Continuous PNAD: unemployment rate is 11.0% and underutilization rate is 23.0% in the quarter ended December
January 31, 2020 09h00 AM | Last Updated: February 03, 2020 04h42 PM
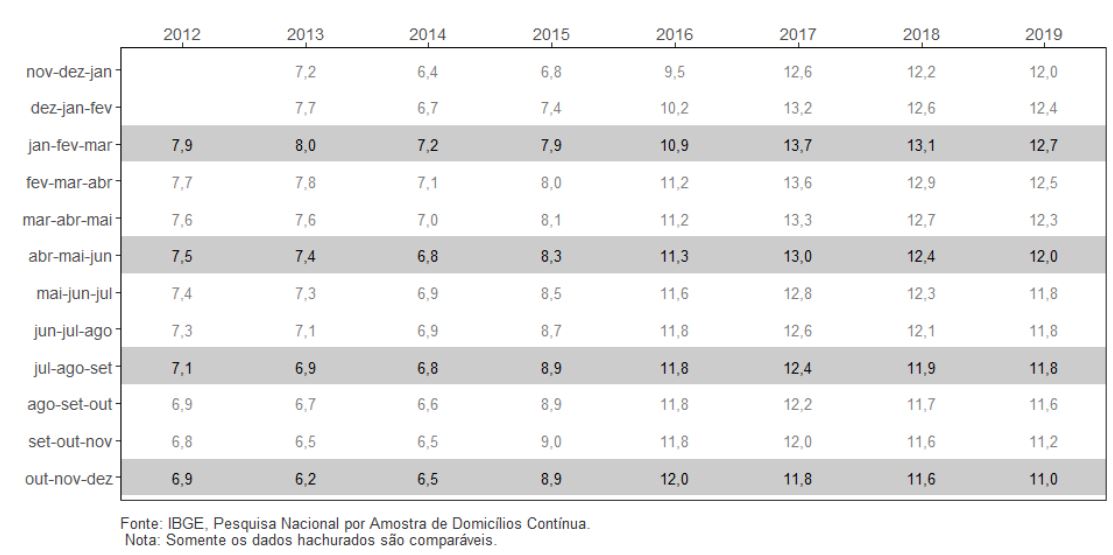
The unemployment rate (11.0%) in the quarter October-December 2019 fell -0.8% percentage points against that of July-September (11.8%). In comparison with the same quarter in 2018 (11.6%), there was a decrease of 0.6 percentage points (p.p.). The average annual rate fell from 12.3% in 2018 to 11.9% in 2019.
| Indicator / Period | Oct-Nov-Dec 2019 | Jul-Aug-Sep 2019 | Oct-Nov-Dec 2018 |
AVERAGE 2019 |
|---|---|---|---|---|
| Unemployment rate | 11.0% | 11.8% | 11.6% | 11.9% |
| Underutilization rate | 23.0% | 240% | 23.8% | 24.2% |
| Usual real earnings | R$2,340 | R$2,317 | R$2,332 | R$2,330 |
| Change of real earnings in relation to: | 1.0% (stability) | 0.4% (stability) | 0.4% | |
The unemployed population (11.6 million) fell 7.1% (883 thousand persons) against the previous quarter and fell 4.3% (520 thousand persons) against the same quarter in 2018. The annual average unemployed population was 12.6 million and fell 1.7% (215 thousand persons) against 2018.
The employed population (94.6 million) increased 0.8% versus the previous quarter (751 thousand persons more). Versus the same quarter in 2018, there was a decrease of 2.0% (1.8 million persons more). In the annual average, the employment population amounted to 93.4 million and was 2.0% (1.8 million persons) above the average in 2018.
In the quarter October-December 2019, there were 26.2 million underutilized persons in Brazil. This amount fell by 4.7% (1.3 million persons) against the quarter July-September 2019. Compared with the same moving quarter in 2018, there was a decrease of 2.5% (a total 670 thousand underutilized persons).
In terms of the annual average, that figure reached 27.6 million, with an increase of 1.2% (or 338 underutilized persons) against 2018.
The compound underutilization rate of the workforce (23.0%) in the moving quarter October-December 2019, with a decrease of 1.1 p.p. in relation to the previous moving quarter. Against the same quarter in 2018, there was a decrease of 0.8 p.p. The annual average underutilization rate was 24.2%, a little below that of 2018 (24.3%).
The number of workers with a formal contract (33.7 million) fell 1.8% (593 thousand persons more) against the previous quarter (July-September) and increased 2.2% (726 thousand persons more) against the same quarter in 2018. The annual average reached 33.2 million, with an increase of 1.1% (356 thousand persons) in relation to 2018.
The number of workers without a formal contract (11.9 million persons) remained stable in comparison with the previous quarter and increased 3.2% (367 thousand persons) against the same quarter in 2018. The annual average (11.6 million) increased 4.0% (446 thousand persons) against 2018.
The category of self-employed workers (24.6 million persons) was stable in comparison with the quarter July-September and increased 3.3% (782 thousand persons) against the same period of 2018. The annual average reached 24.2 million and increased 4.1% (958 thousand persons) in relation to 2018.
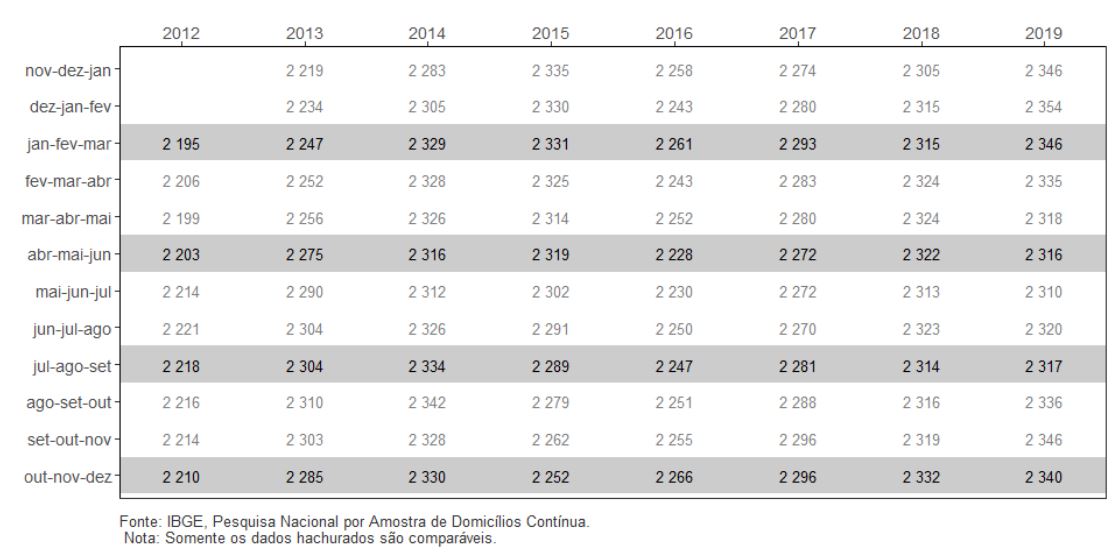
The average usual real earnings (R$2,340) in the quarter October-November-December remained stable in both comparisons. The annual average was R$ 2,330, with a slight change (+0.4%) in relation to 2018.
The usual real wage bill (R$216.3 billion) increased 1.9% in relation to July-September. Against the same quarter in 2018, there was an increase of 2.5%.
The annual average (R$ 212.4 billion) increased 2.5% against 2018. The support material for this release is on the right of the page.
Unemployment Rate - Brazil - 2012/2019
The number of employers (4.4 million persons) remained stable in both comparisons. The annual average (4.4 million) recorded a slight decrease.
The number of domestic workers (6.4 million) was stable in both comparisons. The annual average (6.3 million) recorded a slight increase (0.4%) compared to that in 2018.
The employment population ratio (percentage of employed persons in the population at working age) was estimated at 55.1% in the quarter October-December 2019, with an increase of 0.3 percentage points against the quarter July-September 2019 (54.8%). In relation to the same quarter in 2018, there was an increase of 0.6 percentage points. In terms of the annual average, employment population ratio reached 54.6% in 2019, above 2018 (54,1%) and 2017 (53.9%, the lowest in the annual series). Nevertheless, it is still far from the 2014 estimate (56.9%).
Persons in the workforce (employed and unemployed persons) in the quarter October-December 2019 was estimated at 106.2 million persons and remained stable in comparison with the July-September 2019. Against the same quarter in 2018, there was an increase of 1.2% (1.3 million persons more). In the annual average, that figure reached 106 million, with an increase of 1.5% (1.6 million persons more) against 2018.
Persons out of the workforce (65.4 million persons) increased 0.9% (587 thousand persons more) against the previous quarter. In comparison with the same quarter in 2018, there was stability. In terms of the annual average, that figure reached 65.1 million, with a slight increase (0.1%) versus 2018.
The potential workforce, in the quarter October-December 2019, was estimated at 7.7 million persons. There was stability in both comparisons In terms of the annual average, that figure reached 8.0 million, with a hike of 1.7% against 2018.
The number of discouraged persons was estimated at 4.6 million in the quarter October-December 2019. There was stability in both comparisons. In the annual average, discouraged ones amounted to 4.8 million, with an increase of 1.4% versus 2018.
The percentage of discouraged persons in relation to the population in the workforce or discouraged was 4.2% in the quarter ended December and remained stable in both comparisons. In the annual average, that percentage was 4.3%, the same as in 2018.
The average usual real earnings (R$ 2,340) in the quarter October-November was stable in both comparisons. The annual average stayed at R$ 2,330, with a slight change (+0.4%) against 2018.
Average real monthly earnings, usually earned in the month of reference, from all the activities of employed persons - Brazil - 2012/2019 - (R$)
The analysis of the average usual real earnings from the main job, by groups of activity, of the moving quarter October-December 2019, in relation to the quarter July-September 2019, showed that all the groups recorded stability. The comparison with the quarter October-December 2018 evidenced stability in all the groups.
The analysis of the average real usual earnings from the main job, by employment status, of the quarter October-December 2019, in comparison with the quarter July-September 2019, evidenced an increase in the category of Employee in the public sector (including civil and military servants) (by 1.9%, or R$ 69). The other categories did not record significant changes. In the comparison with the quarter October-December 2018, stability was observed all the positions.
Groups in the moving quarter October-December 2019
The analysis of the number of employed persons, by groups of activity, against the quarter July-September 2019, evidenced increase in the groups: Trade, repair of motor vehicles and motorcycles (2.1%, our more 376 thousand persons), Lodging and feeding (3.3%, or 179 thousand persons) and Other services (by 3.0%, or 151 thousand persons). There was a decrease in the group Agriculture, livestock, forestry, fishing and aquaculture (by 2.1%, or 178 thousand persons).
In comparison with the same quarter in 2018, the following groups recorded increase: Industry (3.3%, or 388 thousand persons), Lodging and feeding (5.2%, or 282 thousand persons) and Other services (4.5%, or 221 thousand persons). The other groups did not record significant changes.
Groups of activity - annual averages
After significant decreases per year (2012-2018), Construction reached 6.7 million workers in 2019. That result, however, points to a slight recovery of 0.5% (or 37 thousand employed persons). Against 2014, the estimate records a decrease by 13.8%, or 1.1 million workers in construction.
In Agriculture, livestock, forestry, fishing and aquaculture, in 2019, there were 8.5 million workers, a stable figure in comparison with that in 2018. Against 2012, when that group reached 10.3 million persons, there was a decrease by 17.4% (or 1.8 million persons).
Industry recorded, in 2019, about 12.0 million workers. Against 2012, it was reduced by 1,0 million. Versus 2014, when there were 13.2 million workers in the group, the decrease was even smaller, 1.2 million.
In Trade, repair of motor vehicles and motorcycles there were, in 2019, 17.7 million workers. That is one of the few groups remaining stable in terms of number of workers.
The group Transportation, storage and mailing had 4.9 million workers in 2019, with an increase of 4.6% in relation to 2018 and 184.% against 2012. That group has recorded increases in the last few years, mainly due to the expansion of land transportation of passengers.
In the group Lodging and feeding there were, in 2019, about 5.5 milllion workers with an increase of 3.7% in comparison with 2018. Compared to 2012, there was an increase of 43.6% (the biggest among all the groups of activity). That increase was mainly due to feeding services, above all, provided by street vendors.
The group Information, communication and financial, real estate, professional and admnistrative activities completed three consecutive years of expansion, having reached 10.5 million in 2019. Against 2012, that activity increased 11.1%.
In Public administration, feedinf, defense, security, education, human health and social services, there were 16.4 million workers in 2019, having recorded an increase of 1.9 million versus 2012 (13.2%) and 1.3 million (8.8%) versus 2014.
Other services encompassed, in 2019, about 5.0 million workers, which is equivalent to 30.9% above what was observed in 2012, and 19.9% above what was recorded in 2014.


