POF 2017-2018: Households with up to R$1.9 K allocate 61.2% of their expenses to food, housing


October 04, 2019 10h00 AM | Last Updated: October 08, 2019 05h25 PM
Households with earnings up to two minimum wages (R$1,908.00) committed more of its budget with food and housing expenditures than those with earnings above 25 minimum wages (R$23,850.00). Together, the two groups accounted for 61.2% of the expenditures of the households with lower earnings, being 22.0% destined to food and 39.2% to housing. Among those with higher earnings, the sum added up to 30.2%, being 7.6% with food and 22.6% with housing.
For the households in the class of higher earnings, the expenditures with food (R$2,061.34) were more than the triple of the average value of the total households in Brazil (R$658.23) and more than six times the value of the class with the lowest earnings (R$328.74).
In addition, 23.9% of the households that earned up to R$1,908.00 contributed with only 5.5% of the average value received in Brazil. This means that, from the monthly average of R$5,426.70, only R$297.18 came from this group. On the other hand, 2.7% of the households that earned more than R$23,850.00 contributed with R$1,080.26 to the overall average. Therefore, this group hijacked nearly 20% of all the values received by the households. This is shown in the Consumer Expenditure Survey - POF 2017-2018.
The survey also unveiled that, together, food, housing and transportation committed 72.2% of the expenses of the Brazilian households, concerning the total consumption expenditures. Taking into account the distribution of the consumption expenditures in the case of food, the proportion of total expenses of the rural condition (23.8%) surpassed that of urban (16.9%), as well as the expenditures with transportation (20% rural and 17.9% urban). Education (4.7%) was the group whose share of urban households (4.9%) doubled that reported for rural households (2.3%).
The share of the expenditure with food away from home in the urban area was 33.9% of the total expenditures with food. It reached 24.0% in the rural area, an increase of 11 percentage points over POF 2002-2003. The average value of the expenditure with food away from home in the urban area was 87.1% higher than in the rural area. Concerning food at home, the average value of the expenditure of the households in urban areas was 15% higher than in the rural areas.
Brazilian households spend, on average, R$4.6 thousand per month
The total household monthly average expenditure in Brazil was R$4,649.03 in 2017-2018, being 7.2% higher in the urban areas (R$4,985.39) and 45.3% lower in the rural areas (R$2,543.15). The highest values were registered in the Central-West (R$5,762.12) and Southeast (R$5,415.49) regions. The North (R$3,178.63) and Northeast (R$3,166.07) were positioned below the average.
The current expenditures represented 92.7% of the total. Shares of 4.1% related to the increase of assets (acquisition of properties, refurbishment and other investments) and of 3.2% to diminish liabilities (amortization of loans and installments of real estate financing) were also recorded.
Concerning the total expenditures, those with consumption accounted for 81.0% of the total, including expenditures with food, housing, transportation, etc., while 11.7% were spent with other current expenditures, like labor costs and banking services, among others. The current expenditures were below the national average in the Central-West (90.8%) and South (90.4%) regions.
The expenditures with consumption were 4.2 percentage points higher in the rural area (84.9%) than in the urban area (80.7%). Nevertheless, the households that lived in rural areas spent 5.3 percentage points less with other current expenses (6.8% against 12.1% in the urban areas). Such differences are explained by expenses with taxes, labor costs and banking services, which are more incurred in the urban areas.
In Brazil, monetary expenditures – paid either by cash, cheque or debit or credit card – represented 81.9% of the total, whereas non-monetary expenditures – coming from own production, business withdrawals, barters, donations and other forms of acquisition not involving monetary payments – represented 18.1%. Non-monetary expenditures posted a bigger share in the rural areas (22.5% against 17.7% in the urban areas). The Central-West Region registered the lowest percentage (15.9%), while the highest one was recorded in the North (19.0%).
Share of expenditures to increase assets drop 1.7 p.p. in 10 years
The comparison between the National Study of Household Expenditure - ENDEF 1974-1975 with the three editions of POF pointed out a jump in the share of the current expenditures between the first and the last one, changing from 79.9% to nearly 93% in 2017-2018. Among the POF editions, however, it remained stable from 2002-2003 onwards.
The share of the expenditures to increase assets, like acquisition and refurbishment of real estate, for instance, reached 4.1% in relation to the total expenditures in POF 2017-2018. This group deeply dropped along the nearly 30 years between ENDEF and POF 2002-2003. This percentage has been showing a slighter change in the period among POFs.
On the other hand, the diminishing of liabilities posted smaller changes in the historical trend. After a steady share in 2002-2003 and 2008-2009, this percentage slightly increased in POF 2017-2018, reaching 3.2%. This percentage got close to that reported in the ENDEF period, when it represented 3.6% of the total expenditure.
Food, housing and transportation account for 72.2% of household expenditure with consumption
The share of expenditures with consumption in the total expenses was 81.0% for Brazil, with a monthly average of R$3,764.51. The average value of the expenditures with consumption by households in rural condition (R$2,158.83) corresponded to 57.3% of the national average and to 53.7% of the average expense of the households in urban condition (R$4,020.98).
The expenditures with food, housing and transportation corresponded to 72.2% of the monthly average expenditure with consumption, which represented 58.4% of the total expenses.
| Distribution of the monetary and non-monetary household monthly average expenditure with consumption, by types of expenditure with consumption, according to the urban or rural housing unit and Major Regions 2017-2018 period |
||||||||||||
|---|---|---|---|---|---|---|---|---|---|---|---|---|
| Household condition and Major Regions |
Distribution of the monthly average expenditures with monetary and non-monetary consumption (%) | |||||||||||
| Total | Type of expenditures | |||||||||||
| Food | Housing | Wearing apparel | Transportation | Hygiene and personal care |
Health assistance |
Education | Recreation and culture | Tobacco products | Personal services | Miscellaneous expenditures | ||
| Brazil | 100.0 | 17.5 | 36.6 | 4.3 | 18.1 | 3.6 | 8.0 | 4.7 | 2.6 | 0.5 | 1.3 | 3.0 |
| Urban | 100.0 | 16.9 | 37.1 | 4.2 | 17.9 | 3.6 | 8.0 | 4.9 | 2.6 | 0.5 | 1.3 | 3.0 |
| Rural | 100.0 | 23.8 | 30.9 | 4.7 | 20.0 | 4.5 | 8.0 | 2.3 | 1.8 | 0.5 | 0.9 | 2.5 |
| North | 100.0 | 21.0 | 36.4 | 5.3 | 16.6 | 5.7 | 5.4 | 3.2 | 2.5 | 0.3 | 1.1 | 2.4 |
| Northeast | 100.0 | 22.0 | 32.4 | 5.1 | 16.2 | 5.0 | 8.0 | 4.7 | 2.5 | 0.4 | 1.3 | 2.4 |
| Southeast | 100.0 | 15.8 | 39.0 | 3.7 | 17.5 | 3.0 | 8.5 | 5.1 | 2.5 | 0.5 | 1.3 | 3.0 |
| South | 100.0 | 17.1 | 35.7 | 4.5 | 20.6 | 3.3 | 7.3 | 3.7 | 2.6 | 0.6 | 1.2 | 3.3 |
| Central-West | 100.0 | 16.6 | 33.4 | 4.5 | 21.0 | 3.6 | 8.0 | 4.7 | 2.7 | 0.4 | 1.3 | 3.8 |
| Source: IBGE, Diretoria de Pesquisas, Coordenação de Trabalho e Rendimento, Pesquisa de Orçamentos Familiares 2017-2018. | ||||||||||||
In regard to food, the proportion of total expenses of the rural condition (23.8%) surpassed that of urban (16.9%), as well as the expenditures with transportation (20% rural and 17.9% urban). This relation was reversed in housing, in which the urban share (37.1%) surpassed the rural one (30.9%).
The expenditures with housing accounted for the biggest share in the monetary and non-monetary household expenditures with consumption, both at national (36.6%) and regional level. The Southeast (39.0%) and North (36.4%) regions recorded the biggest shares. Concerning transportation, the biggest shares were posted by the Central-West (21.0%) ans South (20.6%) regions, both of them above that of Brazil (18.1%). The smallest share in the expenditures with consumption of this group took place in the Northeast Region (16.2%).
The third biggest share in the national expenses with consumption was the group of food (17.5%), a result very close to transportation (difference of 0.6% p.p.). This picture was repeated in the urban condition, in which the share of transportation (17.9%) surpassed that of food by 1.0 percentage point. In the rural condition, the proportion of the expenses with food (23.8%) was higher than those of transportation (20.0%). The Northeast (22.0%) and North (21.0%) regions registered bigger shares than the national average. The Southeast Region recorded the lowest percentage for this group(15.8%).
Education (4.7%) was the group that registered the most relevant difference among the shares in the urban (4.9%) and rural (2.3%) conditions.
Food represents 22.0% of expenses of households earning up to 2 minimum wages
The households with earnings up to minimum wages (R$1,908.00) committed more of its budget with food and housing expenditures than those with earnings above 25 minimum wages (R$23,850.00). This relation reversed concerning the expenditures with transportation and education.
Health assistance registered close percentages in the domestic budget, but when the households with lower earnings committed 4.2% of the budget with medicines, those with higher earnings spent 1.4%. Conversely, the expenses with health plans were 0.4% in the lowest class of earnings and 2.9% in the upper class.
| Distribution of the household monthly average monetary and non-monetary expenditure, by extreme class of total earnings and household monthly asset variation, according to the types of selected expenditures - Brazil - 2017-2018 period |
|||
|---|---|---|---|
| Types of selected expenditures |
Distribution of the household monthly average monetary and non-monetary expenditure (%) | ||
| Total | Extreme classes of total earnings and household monthly asset variation (1) |
||
| Up to R$1,908 (2) | More than R$23,850 | ||
| Total expenditure | 100.0 | 100.0 | 100.0 |
| Current expenditures | 92.7 | 96.6 | 87.0 |
| Expenditures with consumption | 81.0 | 92.6 | 66.3 |
| Food | 14.2 | 22.0 | 7.6 |
| Housing | 29.6 | 39.2 | 22.6 |
| Rental | 15.1 | 20.6 | 10.7 |
| Services and rates | 7.4 | 11.2 | 3.5 |
| Furniture and household articles | 1.4 | 2.1 | 1.1 |
| House appliances | 1.3 | 2.3 | 0.6 |
| Transportation | 14.6 | 9.4 | 15.3 |
| Urban | 1.3 | 2.1 | 0.4 |
| Acquisition of vehicles | 5.6 | 2.3 | 7.5 |
| Health assistance | 6.5 | 5.9 | 5.6 |
| Medicines | 2.9 | 4.2 | 1.4 |
| Health plan/insurance | 2.1 | 0.4 | 2.9 |
| Education | 3.8 | 1.9 | 5.1 |
| Other expenditures with consumption | 12.2 | 14.2 | 10.2 |
| Other current expenses | 11.7 | 4.0 | 20.7 |
| Increase of monthly average household asset | 4.1 | 1.4 | 9.6 |
| Decrease of average household liability | 3.2 | 2.0 | 3.5 |
| Source: IBGE, Diretoria de Pesquisas, Coordenação de Trabalho e Rendimento, Pesquisa de Orçamentos Familiares 2017-2018. Note: The classes refer to total earnings and asset variation, yet simply called classes of earnings. (1) Includes the monetary earnings, the estimated non-monetary earnings from the use and consumption of products acquired through non-monetary expenditures and the asset variation obtained through sales of real estate and withdrawals from financial applications. It also includes the rental estimated by the consumption units with occupation condition different from rented, deducing the expenditures with maintenance, taxes, rates and insurance. (2) Including without earnings. |
|||
Expenses with health increase in all surveys since 1974
The group of food dropped 2.3 p.p. between the two last editions of POF, changing from 19.8% to 17.5%. Housing, education and health assistance increased in relation to 2008-2009, the last one rising in all editions of the survey.
| Share of the household monthly average monetary and non-monetary expenditure with consumption, in ENDEF and POF, according to the types of selected expenditures - Brazil - 1974/2018 |
||||
|---|---|---|---|---|
| Types of selected expenditures | Share in the household monthly average monetary and non-monetary expenditure with consumption (%) | |||
| ENDEF 1974 -1975 (1) |
POF | |||
| 2002-2003 | 2008-2009 | 2017-2018 | ||
| Food | 33.9 | 20.8 | 19.8 | 17.5 |
| Housing | 30.4 | 35.5 | 35.9 | 36.6 |
| Transportation | 11.2 | 18.4 | 19.6 | 18.1 |
| Health assistance | 4.2 | 6.5 | 7.2 | 8.0 |
| Education | 2.3 | 4.1 | 3.0 | 4.7 |
| Other | 18.0 | 14.7 | 14.4 | 15.2 |
| Sources: IBGE, Diretoria de Pesquisas, Coordenação de Trabalho e Rendimento, Estudo Nacional da Despesa Familiar 1974-1975 and Pesquisa de Orçamentos Familiares 2002-2003/2017-2018. (1) Excluding the rural area of the North and Central-West regions. |
||||
Expenditure with food away from home increases 11 p.p. in rural area
The weight of expenditure with food way from home increased 8.7 p.p. in Brazil between POF 2002-2003 and POF 2017-2018. The growth of the percentage in the rural area, which was of 13.1% in 2002-2003, increased 11 p.p., reaching 24.0% in 2017-2018.
The biggest percentages with food away from home in 2017-2018 took place in the Central-West (38.0%) and Southeast (34.2%) regions, which stood above the national average (32.8%). The smallest percentage took place in the North Region (21.4%). The biggest increases between POFs 2002-2003 and 2017-2018 took place in the Central-West (13.5 p.p.) and Northeast (12.8 p.p.) regions.
The Central-West Region registered the highest value of the household monthly average with food away from home (R$277.68). This value was 133.8% bigger than that in the North Region (R$118.79), the lowest one in Brazil.
Between POF 2008-2009 and POF 2017-2018, the only region with a drop in the percentage of the monthly average expenditure with food away from home was the Southeast: from 37.2% to 34.2%. The percentage in the North Region remained unchanged in the same period (21.4%).
Expenditure with food at home varies between 49.7% and 79.4%
Comparing the extreme classes of household monthly earnings, households with lower earnings (up to R$1,908.00) showed a proportion of 20.6% of expenditure with food away from home against 79.4% with food at home. In the households with higher earnings (above R$23,850.00), this proportion in food away from home was 50.3% against 49.7% in expenditure with food at home.
| Household monthly average monetary and non-monetary expenditure with food, by extreme class of total earnings and household monthly asset variation, according to the types of expenditure, with indication of the number and average size of households - Brazil - 2017-2018 period |
|||
|---|---|---|---|
| Type of expenditure, number and average size of households |
Household monthly average monetary and non-monetary expenditure with food | ||
| Total | Extreme classes of total earnings and household monthly asset variation | ||
| Up to R$1,908 (1) | More than R$23,850 | ||
| Value (R$) | |||
| Expenditure with food | 658.23 | 328.74 | 2061.34 |
| Food at home | 442.27 | 261.05 | 1025.48 |
| Food away from home | 215.96 | 67.69 | 1035.86 |
| Distribution (%) | |||
| Expenditure with food | 100.0 | 100.0 | 100.0 |
| Food at home | 67.2 | 79.4 | 49.7 |
| Food away from home | 32.8 | 20.6 | 50.3 |
| Number of households | 69 017 704 | 16 470 313 | 1 842 567 |
| Average size of households (persons) | 3.00 | 2.72 | 3.07 |
| Source: IBGE, Diretoria de Pesquisas, Coordenação de Trabalho e Rendimento, Pesquisa de Orçamentos Familiares 2017-2018 (1) ) Including without earnings. |
|||
The value of the total expenditure with food of the households with higher earnings represented more than the triple of the average value of the total households in Brazil and more than six times the value of the class with lower earnings.
On the other hand, the value of the expenditure with food at home in the class with higher earnings was more than the double of the national average and nearly four times the value in the class with lower earnings. The difference was sharper between the values corresponding to food away from home, which was 4.8 times the value of the national average in the class with higher earnings and 15.3 times the value in the class with lower earnings.
Meat, offal and fish are 20% of expenditures with food at home
In the expenditures with food for consumption at home, the share of the group of Cereals, legumes and oilseeds has been dropping over time: from 10.4% in 2002-2003 to 8.0% in 2008-2009, to 5% in 2017-2018. Oils and fats were also dropping: 3.4%, 2.3% and 1.7%, respectively.
Meat, offal and fish remained the group with the biggest share in the expenditures (20.2%), with a slight loss in relation to 2008-2009 (21.9%).
The share of the group of Beverages and infusions had been increasing: from 8.5% in 2002-2003 to 9.7% in 2008-2009, to 10.6% in 2017-2018. In the same time span, the group of Convenience food evolved from 2.3% to 2.9% and reached 3.4%.
In the group of Oils and fats, the share fell 1.7 p.p. between POF 2002-2003 (3.4%) and the current one (1.7%). Legumes and greeneries, fruits and breads remained stable.
Households in rural zones earn slightly more than half of those in urban areas
The average value received by households, related to the monthly earnings and asset variation (for instance, withdrawals from savings and sale of real estate), reached R$5,426.70 in 2018. It was R$5,806.24 in urban areas, while it was R$3,050.49 in rural areas. In other words, households in rural condition received slightly more than half (52.3%) of the value received in urban areas.
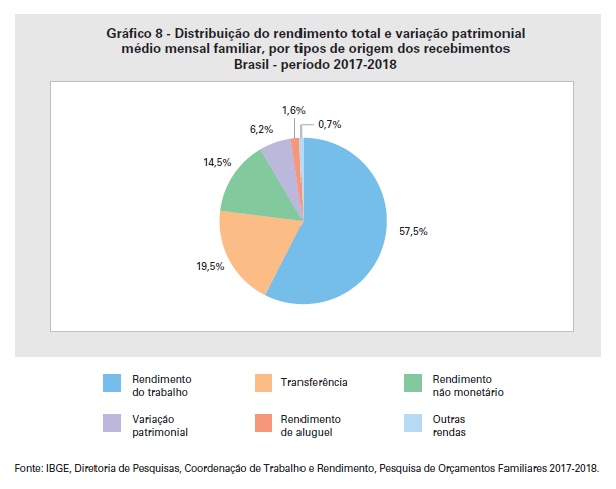
The biggest share in the average value received by households – earnings and asset variation – came from earnings from labor (R$3,118.66), which represented 57.5% of the total. In urban areas, earnings from labor corresponded to 58.4% of the value received and, in rural areas, to 46.8%.
The second biggest share came from cash transfers (19.5%). Among the cash transfers, the INSS retirements and pensions represented 55.0% and the federal social programs, 5.4%. In the urban areas, the transfers represented 19.0% of the total received, whereas they represented 25.3% in the rural areas.
Earnings from rental (of movables and real estate) and the the other income registered the smallest contributions to the average value received by households (1.6% and 0.7%, respectively), both in the urban areas (1.7% and 0.7%, respectively) and in the rural ones (0.9% and 0.9%, respectively).
In addition, 14.5% of the value received by households were non-monetary, i.e., values related to the acquisitions, for which the households did not need to pay for. In rural areas, the weight of this component was even bigger (18.3%), while it was similar to the national average in urban areas (14.2%). Asset variation represented 6.2%, weighting more in rural areas (7.9%).
In all regions, earnings from labor represent more than half the values received
In all the regions, earnings from labor was the component with the biggest share in the total earnings of the households, varying from 52.6% in the Northeast to 61.5% in the Central-West. Conversely, cash transfers recorded the biggest share in the Northeast (24.6%) and the smallest one, in the Central-West (14.3%). In the case of non-monetary earnings, the Northeast and North regions posted shares above the national average (15.7% and 15.6%, respectively), whereas the Central-West reported the smallest share (12.8%).
The highest average value earned by households was in the Central-West (R$6,772.86), corresponding to 124.8% of the national average and, in the Southeast (R$6,391.29), the equivalent of 117.8%. In the Northeast (R$3,557.98) and North (R$3,647.70), the values corresponded to 65.6% and 67.2% of the national average, respectively.
The Southeast was the region with the biggest contribution to the total average value received by households (R$2,789.94), more than half of the national average (51.4%). The smallest contribution was given by the North Region (R$265.09 or 4.9%). Regardless of showing the highest value among the regions, the Central-West participated with only R$525.44 (9.7%).
Only 2.7% of households hijack 20% of overall average in Brazil
Whenever households are analyzed by income range, 23.9% of the households earned up to R$1.908,00 (2 minimum wages) and contributed with only 5.5% of the average value received in Brazil In other words, of the overall monthly average of R$5,426.70, only R$297.18 came from this group.
Taking into account the households that lived with up to R$5,724.00 (6 minimum wages), the contribution was 36.1%. Thus, from the overall average of R$5,426.70, R$1,958.71 came from this group, i.e., 3/4 of the households hijack nearly 1/3 of the average income.
Only 2.7% of the Brazilian households were in the last range, earning more than R$23,850.00 (25 minimum wages). This group contributed with R$1,080.26 to the overall average of R$5,426.70. Therefore, this group hijacked nearly 20% of all the values received by the households.
Non-monetary earnings and cash transfers represent nearly 60% of values received by households with lower income
The analysis of the source of the values received by range of earnings in the households that received up to 2 minimum wages showed that 41% came from earnings from labor; 28.8%, from cash transfers; 0.3%, from rentals; 0.6%, from other sources; 28.2% were non-monetary and 1.1% was due to asset variation.
On the opposite side, households that received more than 25 minimum wages, 60% came from earnings from labor; 12.8%, from cash transfers; 3.7%, from rentals; 0.2%, from other sources; 7.9% were non-monetary and 15.3% was due to asset variation.


