Continuous PNAD: unemployment rate is 11.6% and underutilization rate is 23.9% in quarter ended in December 2018


January 31, 2019 09h00 AM | Last Updated: February 04, 2019 11h11 AM
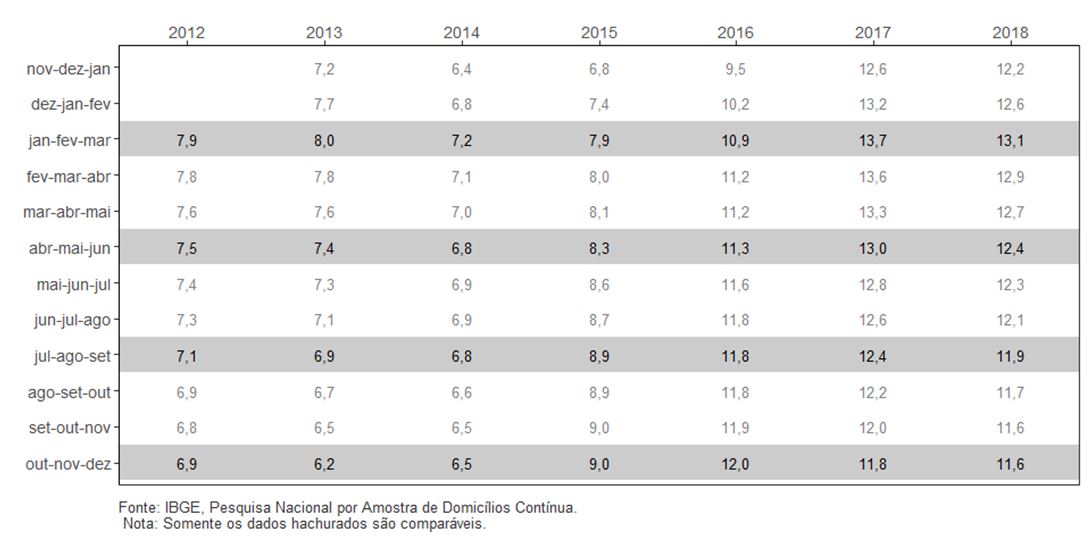
The unemployment rate (11.6%) fell -0.3 percentage points in the period ended in December 2018 in relation to the July-September quarter in 2018 (11.9%). It remained stable compared with the same quarter of 2017 (11.8%). Conversely annual average rate dropped 0.4 percentage points, from 12.7%, in 2017, for 12.3% in 2018.
| Indicator/Period | Oct-Nov-Dec 2018 | Jul-Aug-Sep 2018 | Oct-Nov-Dec 2017 |
|---|---|---|---|
| Unemployment rate | 11.6% | 11.9% | 11.8% |
| Underutilization rate | 23.9% | 24.2% | 23.6% |
| Usual real earnings | R$2,254 | R$2,237 | R$2,241 |
| Change of the usual real earnings in relation to: | 0.8% (stability) | 0.6% (stability) | |
| ANNUAL RATES/Period | 2018 | 2017 | 2012 |
|---|---|---|---|
| Unemployment rate | 12.3% | 12.7% | 7.4% |
| Underutilization rate | 24.4% | 23.9% | 18.4% |
| Usual real earnings | R$2,243 | R$2,230 | R$2,135 |
| Change of the usual real earnings in relation to: | 0.6% (stability) | 5.1% | |
The unemployed population (12.2 million) fell -2.4% (297 thousand less persons) against the quarter from July to September 2018. In relation to the same quarter of 2017, there was stability. Between 2014 to 2018, the average contingent went from 6.7 to 12.8 million (6.1 million persons), that is, almost doubled (high of 90.3%).
The employed population (93.0 million) increased 0.4% (381 thousand more persons) in relation to the quarter from June to Septmeber of 2018 and 1.0% (894 thousand persons) in relation to the same quarter of 2017. The year of 2018 (91.9 milion) had a high of 1.3% in the average of this contingent in relation to the 2017 (90.6 million).
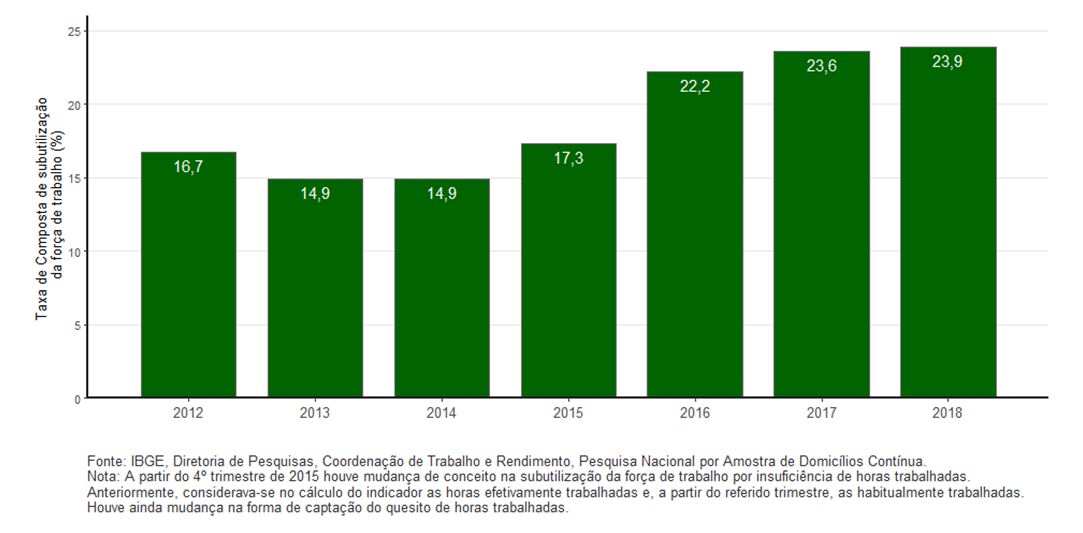
The labor underutilization rate (23.9%) fell -0.3 percentage points in relation to the previous quarter (24.2%). It remained stable when compared with the same quarter in 2017 (23.9%), there was stability. The annual average rate increased 0.5 percentage points, from 23.9%, in 2017, to 24.4% in 2018.
In relation to the quarter from July to September 2018, there was stability (27.0 million) in the underutilized population in Brazil. In relation to the same quarter of 2017, this group grew 2.1% (560 thousand more persons). The annual average of underutilization went from 15.5 million in 2014 to 27.4 million in 2018 (hig of 76.8% or 11.9 million).
The number of discouraged persons (4.7 million) remained stable in relation to the quarter between July and September 2018 and increased 8.1% in relation to the same quarter of 2017 (355 thousand more persons). In relation to the annual average, there is an increase of 209.1% in four years: from 1.9 million in 2014 to 4,7 million in 2018 (3.2 thousand more).
The percentage of discouraged workers in relation to the workforce or discouraged population (4.3%) stood stable in relation to the previous quarter and increased 0.3 pp in relation to the previous quarter of 2017 (4.0%). In four years, the annual average grew 2.7 pp: from 1.6%in 2014,, to 4.3% in 2018.
The number of persons employed in the private sector with a formal contract (excluding domestic workers) was 33.0 million persons, staying stable in both comparisons. In the annual averages, from 2014 to 2018, there was decrease of -10.1% (3.6 milion). The number of employees without a formal contract (11.5 million persons) increased 3.8% (427 thousand more persons) in relation to the previous quarter of 2017, remaining stable in relation to the previous quarter. Among the annual aerage of 2014 to 2018, there was increase of 7.8% (811 thousand more persons) in this contingent.
The number of self-employed workers (23.8 million) rose 1.5% in the comparison with the previous quarter (352 thousand more persons) and 2.8% in relation to the same quarter of 2017 (650 thousand more persons). Concerning the annual averages, in 2012, nearly 22.8% of the emplouyed population (or 20.4 workers) were self employed. This percentage increased to 25.4% (23.3 million) in 2018.
The number of employers (4.5 million persons) remained stable in both comparisons. Conversely, the annual average increased 24.4% from 2012 to 2018 (867 thousand more persons).
The category of domestic workers (6.3 million persons) held steady in both comparisons. From 2014 to 2018, nearly 269 thousand persons (high of 4.5%) joined this position.
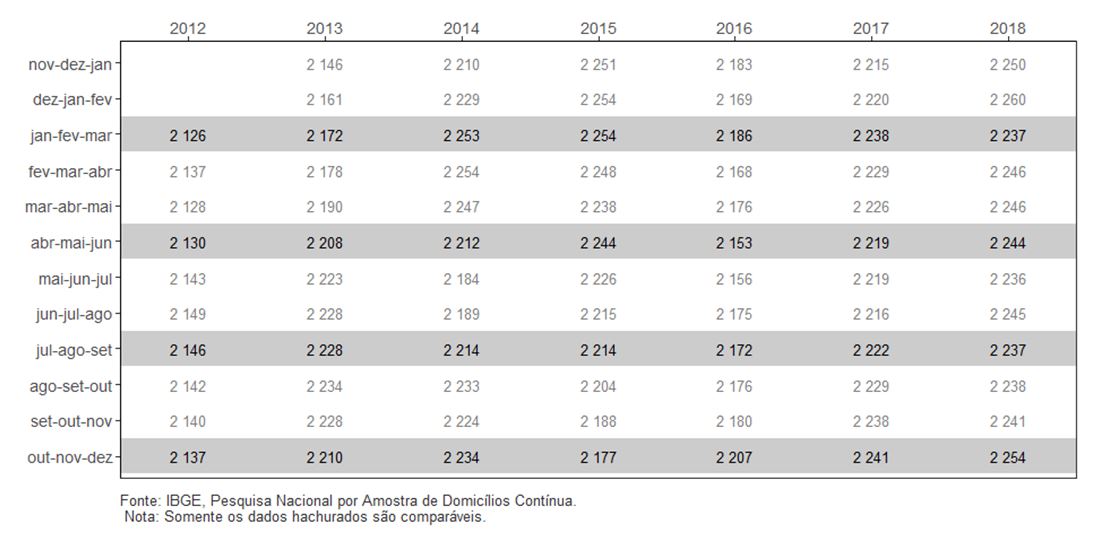
The average usual real earnings (R$2,254) remained stable in both comparisons. In the annual average, from 2012 to 2018, there was high of 5.1% and, against 2014, a positive change of 0.7%. The usual real wage bill (R$204.6 billion) also remained stable in both comparisons. In the annual average, there was increase of 9.0% between 2012 and 2018. The support material of Continuous PNAD is on the right.
Table 1 - Unemployment Rate - Brazil - 2012/2018
The compound rate of labor underutilization - percentage of unemployed persons or time-related underemployed persons or persons in the potential workforce in relation to the extended workforce - was 23.9% in the quarter ended in December, representing a change of -0.3 percentage points over the previous quarter (24.2%). The rate remained stable when compared with the same quarter in 2017, when it had been estimated at 23.6%.
Nearly 27.0 million persons were underutilized in Brazil in the quarter ended in December. This number presented stability over the previous quarter, when underutilization was estimated at 27.3 million persons. Compared with the same quarter of 2017, when there were 26.4 million underutilized persons, this estimate changed 2.1%, representing an amount of 560 thousand more underutilized persons.
The contingent of time-related underemployed persons was estimated at nearly 6.9 million persons in the quarter ended in December, stable in relation to the previous quarter. Compared with the same quarter of 2017, it expanded 7,0%, when there was in Brazil 6.5 million underemployed persons.
Compound rate of underutilization of the workforce – quarters from October to December – 2012/2018 Brazil (%)
The number of persons out of the labor market was estimated at nearly 65.4 million persons. This population remained stable over the previous quarter. Over the same quarter a year ago, there was expansion of 1.1% (increase of 733 thousand persons).
The number of discouraged persons was estimated at nearly 4.7 million, stable in relation to the previous quarter. In relation to the same quarter of 2017, this indicator also posted a positive change (8.1%), with 4.4 million discouraged persons.
The percentage of discouraged workers in relation to the workforce or discouraged population was estimated at 4.3%, stable in relation to the previous quarter (4.3%). In the comparison with the same quarter a year ago, when the rate was estimated at 4.0%, there was increase (0.3 percentage points).
The contingent in the workforce – employed and unemployed persons was estimated at 105.2 million persons. This group remained stable in the comparison with the previous quarter and grew 0.7% (increase pf 778 thousand persons) in relation to the same quarter of 2017.
The number of employed persons was estimated at nearly 93.0 million. It increased 0.4% (381 thousand more persons) over the previous quarter. It rose 1.0% over the same quarter a year ago (894 thousand more persons).
The employment-population ratio – percentage of employed persons in the working-age population – was of 54.5% and remained stable in both comparisons.
The contingent of employees in the private sector with a formal contract (excluding domestic workers) was of 33.0 million persons, remaining stable against the previous quarter. It is also stable in relation to the same quarter of 2017:
The category of employees in the private sector without a formal contract (11.5 million persons) stood stable in relation to the previous quarter. It rose 3.8% over the same quarter a year ago (427 thousand more persons).
The number of self-employed workers (23.8 million persons) rose 1.5% compared with the previous quarter (352 thousand more persons). In relation to the same period a year ago, there was a high of 2.8% (+650 thousand persons).
The category of the employers (4.5 million persons) remained stable both in relation to the previous quarter and to the same quarter of 2017. The category of domestic workers (6.3 million persons) remained stable when compared with the previous quarter and also with the same quarter of 2017.
Estimated at 11.6 million persons, the group of workers in the public sector (including statutory servants and military) remained stable against the previous quarter and the same quarter of 2017.
The average usual real earnings from all jobs of the employed persons were estimated at R$2,254, holding steady over the previous quarter and same quarter of 2017.
Average monthly usual real earnings from all jobs of employed persons - Brazil - 2012/2018 - (R$)
2012-2018 Retrospective
In 2018, the workforce in Brazil (104.7 million persons) grew 0.8% (816 thousand more persons) in relation to 2017. Whereas employment expanded (+1.2 million), unemployment decreased 398 thousand. Over 2012, the country's workforce increases 8.4%, which represented a rise of 8.1 million persons.
The employed population (91.9 million) recorded expansion of 1.3% (1.2 million more in relation to 2017 (90.6 million). In relation to 2014, when the employed population was estimated at 92.1 million, the reduction hit 252 thousand persons.
From 2014 to 2018, the unemployed went from 6.7 to 12.8 million (increasing 6.1 million), that is, almost doubled (90.3%). In 2014, the Brazilian labor market posted the lowest unemployment-population ratio since the beginning of the time series of the survey (2012). Comparing 2018 with the previous year, this estimate reduced by 398 thousand (-3.0%). The reduction in 2018 interrupted the annual upward trend taking place in the unemployed population since 2015.
As a consequence of the increase in the contingent of the employed and the unemployment decrease, the unemployment rate went from 12.7% in 2017 to 12.3% in 2018, representing, thus, an offset of the growth trend started in 2015.
After its lowest level in 2017 (53.9%, the employment-population ratio grew again in 2018 (54.1%). However, it is still distant from the 2014 rate of 56.9%.
Labor Underutilization
Despite the reduction in the unemployed population, labor underutilization - percentage of unemployed persons or time-related underemployed persons or persons in the potential workforce in relation to the extended workforce - in the workforce in Brazil increased 3.4% in relation to 2017, with 27.4 million persons in 2018, the highest figure of the series (24.4%). The lowest rate of the series occurred in 2014 (15.1%).
The growth of the underutilization was influenced by the expansion of the time-related unemployment which went from 6.0 million in 2017 to 6.6 in 2018. Over 2014, the group of the underemployed had expansion of 2.1 million persons (45.7%) and of the unemployed of nearly 6.1 million persons (90.3%).
The number of discouraged persons was estimated at nearly 4.7 million in 2018, the highest figure of the series. The growth was of 13.4% over 2017. he lowest estimate for this population occurred in 2014 (1.5 million persons). This way, in 4 years, the number of discouraged persons in Brazil increased by 3.2 million.
Ways of insertion in the labor market
In 2012, Brazil had 34.3 million persons employed in the private sector with a formal contract; in 2014 this contingent reached the highest level of the series (36.6 million). Four years later, 3.7 million workers lost the formal contract and Brazil had 32.9 million workers in this category.
Since from the beginning of the Continuous PNAD implantation a downward trend was seen in workers without a formal contract in the private sector, something observed up to 2015, when there was a trend reversion. The year 2018 closed with 11.2 million workers without a formal contract, the highest figure of the series.
IN 2012, there were 6.1 domestic workers. The group had its lowest figure in 2014 (6.0 million). In 2018, this category achieved 6.2 million, that is, in four years nearly 269 thousand persons entered labor market in this modality.
The number of employers achieved 4.4 million in 2018. The comparison with 2012 pointed out a growth of 24.4% in this category (867 thousand more persons). It is important to mention that this increase took place mainly in the range of small employers involved in informal activities.
Self-employment which involved, in 2012, 22.8% of the workers (20.4 million) increased to 23.3 million in 2018, corresponding to 25.4% of the employed. The increase in the share of this category was due to the increase of 2.9 million self-employed workers in relation to 2012. Of note is the increase of 2.0 million reported in this form of insertion over 2014.
Groups of activity
Construction was the group that most lost workers considering the transition between 2017 (6.8 million) to 2018 (6.7 million), with reduction of 2.4%. In seven years, this group lost 798 thousand workers.
In Agriculture, forestry, fishing and aquaculture, in 2018, there was 8.5 million workers, a contingent practically stable over that of the previous year (8.6 million). Over 2012, when this group reached 10.3 million persons, the decrease was of 17.4% (1.8 million less persons).
The General Industry closed the years of 2018 with 11.8 million workers. In seven years, it underwent a reduction of its contingent in by 1.3 million. Over 2014, when there were nearly 13.2 million workers were employed in this group, the drop was even bigger: 1.4 million
In Trade, repair of motor vehicles and motorcycles there was in 2018, 17.5 million workers. This is one the few groups that maintained the contingent of workers relatively stable, mainly due to the fact that it is more suitable to informality.
About 4.7 million workers were inserted in the group of Transportation, storage and mailing in 2018. This group has been rising over the last years probably related to the growth in the number of "application drivers".
About 5.3 million workers were inserted in the group of Transportation, storage and mailing in 2018. Having increased by nearly 1.5 million workers (increase of 38.2%), it was one of the few groups that recorded an expressive increase over the last 7 years. The growth was of 1.1 million, that is, 25.6% over 2014. This change is mainly due to food services, particularly concerning street vendors.
The group Information, communication and financial, real estate, professional and administrative activities, which dropped in 2016, grew back again in 2017 and, in 2018, reached 10.1 million of workers but still below the 2014 figure (10.3 million).
In Public administration, defense, social security, education, human health and social services there were 16.1 million workers in 2018, representing a growth of about 1.6 million workers over 2012 (10.8%) and 970 million in relation to 2014.
In Other services, in 2018, there was nearly 4.8 million workers, 25.7% more than in 2012, and 15.2% above 2014. The upward trend in this group is mainly justified by its suitability to informal job positions.
Income
The average usual real earnings from all jobs of persons with income from labor was estimated at R$2,243, recording stability in relation to the 2017 estimate (R$2,230). It increased 5.1% when compared with 2012. However, it remained stable in relation to 2014.
The average usual real wage bill from all jobs of persons with income from labor was estimated at R$200,954, remaining virtually stable in relation to the 2017. It advanced 9.0% when compared with 2012. However, it remained stable in relation to 2014.


