PAS 2015: services sector generates revenue of R$1.4 trillion


September 22, 2017 10h00 AM | Last Updated: October 03, 2017 08h21 AM
In 2015, the services sector comprised 1,286,621 enterprises that generated R$1.4 trillion of net operating revenue and R$856.0 billion of gross value added. The sector employed 12.7 million persons, accounting for R$ 315.0 billion paid as salaries, withdrawals and other compensation.
The segment of Transportation, support activities for transportation and mailing concentrated the biggest share of net operating revenue (29.3%). In the analyses divided by activities, the enterprises of Telecommunication were the leaders in revenue generation (11.3%).
The average employment of the services sector was of 10 persons per enterprise. Transportation, support activities for transportation and mailing concentrated the largest enterprises (14 employed persons per enterprises on average). The segments of real estate activities and maintenance and repair services registered the lowest average (four employed persons per enterprise).
The average monthly salary stood at R$1,911. The enterprises in the sector of information and communication had the highest salary average (R$3,831) and services rendered mainly to families, the lowest one (R$1,178). Professional, administrative and complementary services concentrated the greatest share of employed persons (40.0%) and of wage bill (35.9%).
Information such as this can be found in the Annual Survey of Services (PAS) 2015, which analyses the producing structure of the sector of non-financial services in the country. For the complete publication, click here.
In 2015, Transportation, support activities for transportation and mailing concentrated the greatest share of revenue (29.3%).
The segment of information and communication services, which accounted for the biggest part of the net operating revenue in 2007 (31.3%), fell to the third position in 2015 (22.8%). The other groups gained participation, with a highlight to Transportation, support activities for transportation and mailing, which went from the second position in 2007 (28.7%) to the fist one in 2015 (29.3%), and professional, administrative and complementary services, which occupied the third position in 2007 (23.0%) and rose to the second one in 2015 (26.8%). Those three groups together accounted for 78.9% of the net operating revenue generated in the enterprises of the services sector in 2015, against 83.0% in 2007.
In terms of value added, Professional, administrative and complementary services remained as the main segment in 2015 (34.3%), with increased participation in relation to 2007 (30.3%). The segment of Transportation and support services for transportation went from the third to the second position, but lost participation from 2007 (24.2%) to 2015 (24.0%). Information and communication services, in turn, lost participation, moving from 27.2% (2007) to 19.3% (2015) and fell from the second to the third position.
Professional, administrative and complementary services concentrated 40% of employed persons and 35.9% of wage bill, in 2015
Professional, administrative and complementary services remained with the greatest share of employed persons. In 2015, 40.0% of the employed persons were from this group, a little less than the 40.2% of 2007. Services rendered to families gained one position in 2015, reaching the second place in terms of employed personnel (22.6%) against 21.0% in 2007. Transportation, support activities for transportation and mailing lost representation, falling from the second position in 2007 (21.3%) to the third one in 2015 (20.5%).
In relation to the wage bill, the order of the segments did not change between the two years; professional, administrative and complementary services remained as the main contributor and was the only of the three major ones which increased participation (35.9% in 2015 and 34.0% in 2007), followed by Transportation, support activities for transportation and mailing (25.2% in 2015 and 26.5% in 2007) and information and communication services (16.4% in 2015 and 17.9% in 2007).
In 2015, average salary in services sector was R$1,911
The enterprises of the services sector reduced their size in terms of employed personnel: the average changed from 11 (2007) to 10 (2015) employed persons per enterprise. In 2015, the activity of Transportation , support activities for transportation and mailing concentrated the largest enterprises, with 14 employed persons per enterprises. The segments of real estate activities and maintenance and repair services registered the lowest average, both with four employed persons per enterprise.
In 2015, the average monthly salary stood at R$1,911. The enterprises in the sector of information and communication had the highest salary average (R$3,831) and the services rendered mainly to families, the lowest one (R$1,178). With the exception of real estate activities (R$1,588 in 2015 and R$1,694 in 2007), all the other segments reached a real increase in this indicator from 2007 to 2015.
The eight-firm concentration ratio went from 15.1% (2007) and to 10.1% (2015), indicating that the services sector has become less concentrated, with the eight larger enterprises losing participation in the total of the net operating revenue of the sector. Although the segment of information and communication was the most concentrated one in both years (40.2% in 2015 and 46.1% in 2007), its concentration ratio ranged from 25% to 50%, which is typical of little concentrated activities. The other ones, in both years, recorded concentration ratios below 25%; therefore; those markets are classified as deconcentrated.
|
Table 1 - Average employed persons per enterpirse, average monthly salary |
||||||
| Non-financial services segments | Average employed persons per enterprise | Average monthy salary (em R$ de 2015) (1) |
Eight-firm concentration ratio (%) (2) | |||
|---|---|---|---|---|---|---|
| 2007 | 2015 | 2007 | 2015 | 2007 | 2015 | |
| Total | 11 | 10 | 1 657 | 1 911 | 15.1 | 10.1 |
| Services rendered mainly to families | 7 | 7 | 972 | 1 178 | 10.3 | 8.0 |
| Information and communication services | 10 | 10 | 3 696 | 3 831 | 46.1 | 40.2 |
| Professional, administrative and complementary services | 14 | 13 | 1 402 | 1 715 | 7.9 | 6.4 |
| Transportation, support activities for transporation and mailing | 17 | 14 | 2 070 | 2 359 | 19.4 | 15.7 |
| Real estate activities | 6 | 4 | 1 694 | 1 588 | 10.0 | 6.9 |
| Maintenance and repair services | 4 | 4 | 1 135 | 1 299 | 13.2 | 11.5 |
| Other services activities | 16 | 11 | 1 973 | 2 464 | 10.3 | 16.0 |
| Source: IBGE, Diretoria de Pesquisas, Coordenação de Serviços e Comércio, Pesquisa Anual de Serviços 2015. | ||||||
Telecommunications boosted revenue generation in 2015
In the analysis by activities, in 2015, telecommunication enterprises kept the first place in the generation of net operating revenue of the total of PAS, despite having lost participation from 2007 (18.9%) to 2015 (11.3%). Next are cargo road transportation (10.8%) and technical-professional services (10.7%), which in relation to 2007 exchanged positions. Food services (7.7%) rose from the sixth to the fourth position and information and technology activity (7.2%) lost a position, decreasing to the fifth place.
Non-real estate renting and management of intangible assets (3.1%) went up from the 17th to the 10th position. Purchase, sale and rent of own properties (1.8%) also gained seven positions, going from the 23rd in 2007 to the 16th position in 2015. These were the activities that mostly gained participation in the ranking of the net operating revenue.
The two activities that mostly lost positions were: air transportation, (2.5%) that occupied the tenth position and went to the 15th place; and the activity of edition and edition integrated to printing (1.3%), that decreased from the 11th place to the 22nd.
| Ranking of the net operating revenue of the PAS total, according to the activities of the services segments Brazil - 2007/2015 |
||||
|---|---|---|---|---|
| Activities | Ranking of the net operating revenue | |||
| 2007 | 2015 | |||
| (%) | Position | (%) | Position | |
| Telecommunications | 18.9 | 1 | 11.3 | 1 |
| Technical-professional services | 9.9 | 2 | 10.7 | 3 |
| Cargo road transportation | 9.7 | 3 | 10.8 | 2 |
| Information technology | 6.5 | 4 | 7.2 | 5 |
| Passenger roas transportation | 5.6 | 5 | 4.6 | 7 |
| Food services | 5.5 | 6 | 7.7 | 4 |
| Storage and support activities for transportation | 5.4 | 7 | 6.2 | 6 |
| Audiovisual services | 3.1 | 8 | 2.9 | 11 |
| Financial, safety and social security support services | 3.1 | 9 | 3.2 | 8 |
| Air transportation | 2.8 | 10 | 2.5 | 15 |
| Edition and edition integrated to printing | 2.7 | 11 | 1.3 | 22 |
| Other services rendered mainly to enterprises | 2.5 | 12 | 3.1 | 9 |
| Services of investigation, surveillance, safety and transportation of values | 2.3 | 13 | 2.7 | 12 |
| Services for buildings and landscape activities | 2.1 | 14 | 2.6 | 13 |
| Recruitment, selection and placement services | 2.0 | 15 | 1.7 | 17 |
| Mail and other delivery activities | 2.0 | 16 | 1.5 | 20 |
| Non-real estate rents and management of non-financial intangible assets | 2.0 | 17 | 3.1 | 10 |
| Office and administrative support services | 1.7 | 18 | 2.5 | 14 |
| Lodging services | 1.6 | 19 | 1.6 | 19 |
| Sewage, collection, treatment and disposal of waste and recovery of materials | 1.3 | 20 | 1.6 | 18 |
| Waterway transportation | 1.3 | 21 | 1.4 | 21 |
| Railway and subway transportation | 1.3 | 22 | 1.2 | 23 |
| Trade and lease of own real estate | 1.2 | 23 | 1.8 | 16 |
| Maintenance and repair of motor vehicles | 0.8 | 24 | 1.0 | 25 |
| Pipeline transportation | 0.7 | 25 | 1.2 | 24 |
| Intermediation in trade and lease of real estate | 0.7 | 26 | 0.8 | 28 |
| Cultural, recreational and sports activities | 0.6 | 27 | 0.7 | 29 |
| Personal services | 0.6 | 28 | 0.8 | 27 |
| Travel agencies, tour operators and other tourism services | 0.5 | 29 | 0.6 | 30 |
| Continuing Education Activities | 0.5 | 30 | 0.9 | 26 |
| Maintenance and repair of computer and communication equipment | 0.5 | 31 | 0.5 | 31 |
| Support services for agriculture and forestry | 0.4 | 32 | 0.4 | 32 |
| Maintenance and repair of personal and domestic products | 0.3 | 33 | 0.2 | 33 |
| News agency and other information services | 0.1 | 34 | 0.1 | 34 |
| Source: IBGE, Diretoria de Pesquisas, Coordenação de Serviços e Comércio, Pesquisa Anual de Serviços: 2007/2015. | ||||
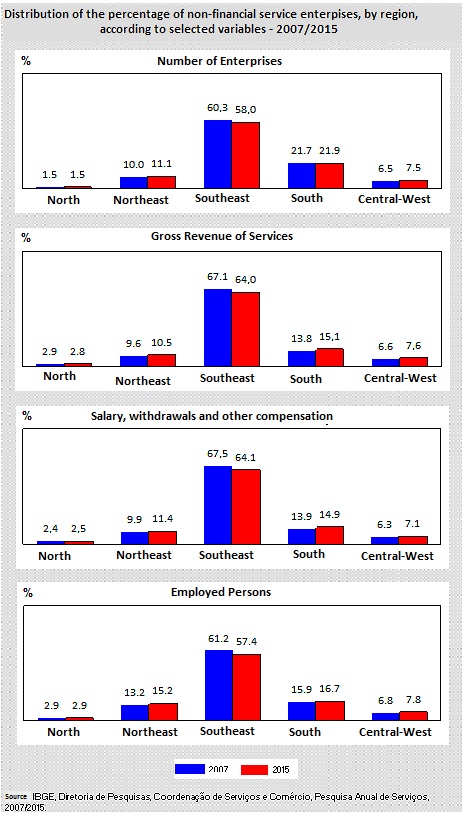
Southeast remains as leader of the Services Sector in 2015
The Southeast presented the biggest concentration of enterprises, of gross revenue of service rendering, of salaries, withdrawals and other compensation of employed persons. Both in 2007 and in 2015, that was the regions responsible for more than 50.0% of the total of the four analyzed variables.
In 2015, 58.0% of the enterprises of the services sector were located in the Southeast and 21.9% in the South. In the comparison between 2007 and 2015, the Southeast lost participation, whereas the North held steady and the other regions went up. The Southeast also concentrated, in 2015, the generation of gross revenue of services (64.0%), but, just as the North, it lost representativeness in relation to 2007, whereas the other regions had its participation expanded.
The Southeast lost contribution in salaries, withdrawals and other compensation from 2007 (67.5) to 2015 (64.1%), despite having kept a greater concentration of the wage bill. The participation of the Northeast in salaries was the one that mostly increases: from 9.9% (2007) to 11.4% (2015).
In relation to the employed persons, the Southeast was also the highlight (57.4%), although it lost representation. Except for the North, which kept the same level, the other regions gained participation in job positions. The Northeast had the biggest percentage gain in the total of employed persons, going from 13.2% (2007) to 15.2% (2015).