Continuous PNAD: Central West Region led decrease in daily water supply from 2016 to 2017
April 26, 2018 10h00 AM | Last Updated: May 02, 2018 04h30 PM
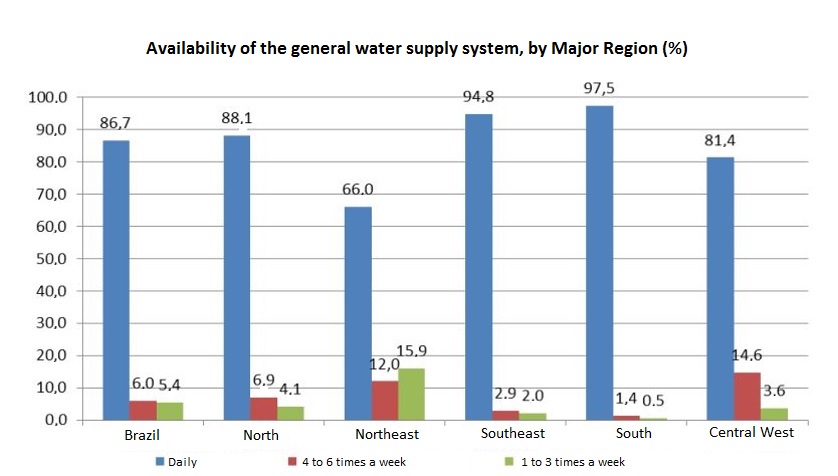
In 2017, Brazil had 69.8 million housing units, out of which 67.8 million (97.2%) had piped water. Out of that total, 85.7% (or 59.8 million) had the general system as their main source of water supply and 51.8 million in this group (86.7% of it) had daily availability of water. The percentage is slightly below that of 2016 (87.3%), and the main change was mainly observed in the Central West, where, between 2016 and 2017, there was decrease from 94.8% to 81.4% in the proportion of housing units with daily availability of water supply. In the Federal District the percentage of housing units with daily water supply fell from 99.7% to 43.3%, in the period.
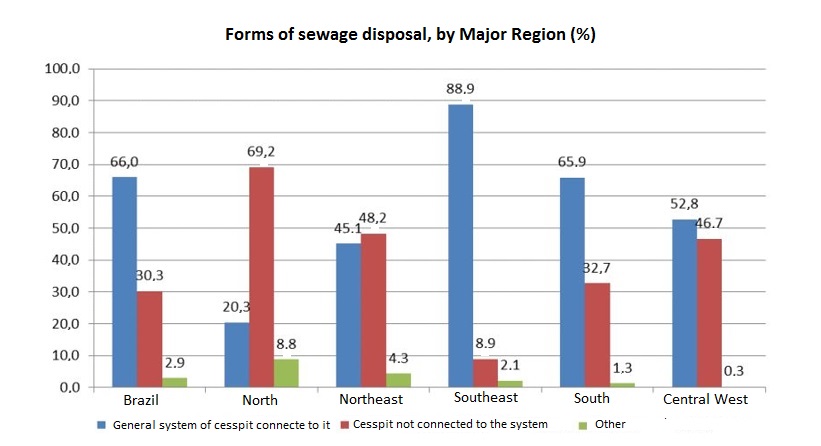
The survey shows that 97.7% of the housing units had a bathroom for exclusive use and in 66.0% of them sewage was disposed by means of a general system or cesspool connected to the system. In 30.3% (21.1 million housing units) sewage disposal depended on a cesspool not connected to the system, whereas, in 2.9% (2.0 million housing units) there was another way (directly into the river, for example), in a proportion that reached 8.8% in the North Region.
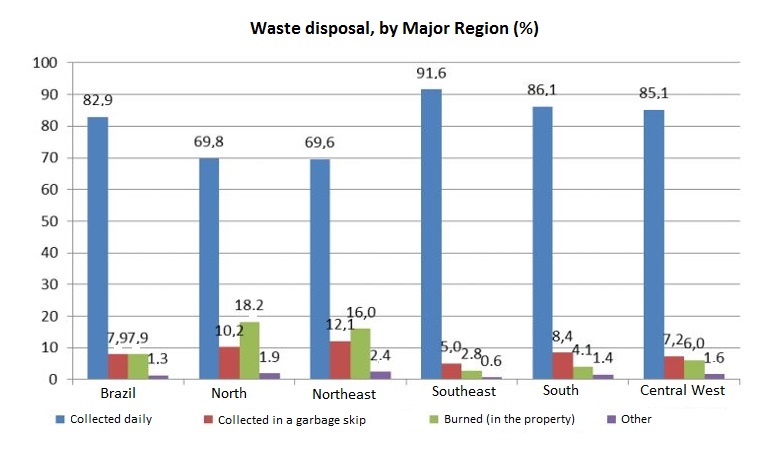
The percentage of housing units where garbage collection was done directly by urban cleaning companies was 82.9%. In 7.9% of the housing units garbage was collected in a cleaning service skip, whereas in 7.9% of them it was burned in the porperty. This type amounted to 18.2% in the North and 16.0% in the Northeast.
From 2016 to 2017, the proportion of housing units in which at least one resident had a mobile phone rose from 92.3% to 92.7%, whereas the proportion relative to fixed elephony fell from 34.5% to 32.1%. In the North Region, the percentage of housing units with mobile telephones increased from 88.1% to 88.8%. The percentage of housing units with landline telephony recorded decrease in all the areas, the main highlight being the Southeast (from 50.0% to 47.0%).
In the country, the percentage of housing units with a computer, including portable ones, fell from 46.2% to 44.0%, in the period. All the areas recorded decrease in this proportion.
There were washing machines in 63.8% of the housing units, in 2017, versus 63.0%, in 2016. The smalles proportion of housing units with that durable good was seen in the Northeast (34.3%) and the biggest, in the South (84.4%). In Brazil, there was a car in 47.6% of the housing units, and in 22,4%, a motorcycle. Both were present in 10.8%.
In 2017, the Brazilian resident population was estimated at 207.1 million persons, 4.2% more than in 012. The biggest population increases in the period were registered in the Central West (7.6%) and Norheast (7.3%).
Between 2012 and 2017, the white population made up 90.4 million persons, in 2017, a decrease of 2.4% in relation to 2012 (92.6 million). The black and brown populations increased 21.8% and 77%, respectively, in the period.
Those data are part of General Characteristics of Housing Units and of Residents, in the Continuous National Household Sample Survey (PNAD-C) 2017, which brings data on housing units (coverage and coating of walls, for either privately-owned or rented places, main durable goods, presence of bathroom, existence of a general water supply system, of sewage and garbage disposal services) for 2016 and 2017, and residents (geographic distrbution of the population, sex and age and color or race), from 2012 to 2017. The support material for this release is available on the right of the page.
In the Federal District, daily water supply fell from 99.7% to 43.3%
Among the 69.8 million housing units in the country, estimated by Continuous PNAD in 2017, 97.2% (67.8 million housing units) had piped water. In 85.7% of them, the main source of supply was the general supply system. In 6.6% of the housing units, the main source of supply was a deep or artesian well; in 3.3%, a shallow or groundwater well; 2.1%, a source or spring and in 2.3% another form of supply.
A total 86.7% of the housing units covered by the general supply system had daily access to water; 6.0%, 4 to 6 times a week and 5.4%, 1 to 3 times. In relation to 2016, there was an increase (20.4%), with 607 thousand units more being supplied 4 to 6 times a week, whereas in housing units supplied 1 to 3 times a week there was decrease (6.2%) by 217 thousand housing units.

Among the Major Regions, the percentage of housing units with piped water changed from 92.2%, in the Northeast, to 99.8%, in the South. The North Regions presented the smallest proportion of housing units in which the main source of water supply was the general system (59.2%), whereas the Southeast had the biggest percentage (92.5%).
As for the general system availability, the Northeast recorded the smallest percentage of housing units with daily supply (66.0%), whereas the South Region recorded the biggest (97.5%). From 2016 to 2017, the Central West recorded a decrease in the daily availability from 94.8% of the housing units to 81.4%, whereas the general supply of water 4 to 6 times a week increased from 3.0% to 14.6%. The main reason for that behavior was water rationing in the Federal District, in 2017, which led to a decrease in the daily availability of water from 99.7% (2016) to 43.3% (2017) and an increase in the distribution from a general system 4 to 6 times a week, from 0.2% (2016) to 54.0% (2017).
In the Central West, percentage of housing Units with full-time electricity records decrease
The survey shows that 99.8% of the housing units in Brazil had access to electricity, either provided by the general supply company, or from alternative sources. In 99.5% of the total (69.4 million housing units), electricity came from the general supply company hand there was full-time availability in 99.2% of the cases (68.8 million housing units).
In the North Region, 99.8% of the housing units there was electricity provided by the general supply company or from an alternative source, whereas, in the other regions, that proportion changed from 99.5% to 100%. IN the North, where 96.4% of the housing units used electricity provided by the general supply company, 98.9% also counted on alternative sources.
Among the housing units which had the general electricity supply company as a source, the percentages of those which had full-time availability were: 99.3% in the Southeast; 99.2% in the South and Northeast; 98.6% in the North Region; and 98.3% in the Central West. That Major Region, in 2016, had 99.2% of full-time supply, that is, it recorded decrease in this type of availability.
In about one third of the housing units, sewage is not disposed by the public sewer system
The survey shows that 97.7% of the housing units in the country had a bathroom for exclusive use and that in 66.0% (65.9% in 2016) of them sewage was transported by the public system of by a cesspit connected to it. In 30.3% (21.1 million housing units) sewage was transported by a cesspit not connected to the public system, whereas in 2.9% (2.0 million housing units) there was another form of sewage disposal (directly into the river, for example). In 2016, sewage disposal by means of a cesspit not connected to the system was a reality in 29.7% of the housing units, whereas 2.8% some other form.

The percentage of housing units that had a bathroom for exclusive use changed from 91.1%, in the North Region, to 99.7%, in the Southeast. On the other hand, the proportion of housing units in which sewage was disposed by the public system or by a cesspit connected to it varied among the Regions. A comparison with figures in 2016 shows that these proportions recorded positive changes in the North Region (from 18.9% to 20.3%), Northeast (from 44.3% to 45.1%) and South (from 64.8% to 65.9%), whereas the Southeast (from 89.0% to 88.9%) remained stable and the Central West recorded a negative change (from 54.9% to 52.8%).
As for cesspits not connected to the system, the North had the biggest percentage in 2017 (69.2%) and the Southeast, the smallest (8.9%), although both have recorded decrease in relation to 2016, when figures were 68.1% and 8.6%, respectively. It is worth mentioning that, in the North Region, 8.8% of the housing units used another form of disposal (9.4% in 2016), a proportion above that observed in the other areas, and different from the national result (2.9%).
Burning of waste reached 18.2% in the North and 16.0% in the Northeast
In 2017, the percentage of housing units in the country whose waste was collected directly by a sanitation company was 82.9% (57.8 million housing units). In 7.9% of the cases (5.5 million housing units), waste was disposed in a garbage skip of the sanitation company, and in 7.9% (5.5 million housing units) it was burned in the property.
The destination of garbage showed a predominance of direct collection by a sanitation company in all the Major Regions, but with some differences. Those with percentages below the national result were the Northeast (69.6%) and North (69.8%). The Southeast (91.6%), South (86.1%) and Central West (85.1%), on the other hand, recorded proportions above the national figure (82.9%).
In the South (8.4%), Southeast (5.0%) and Central West Regions (7.2%), the second most common destination of garbage was the sanitation company garbage skip. In the North (18.2%) and Northeast (16.0%) burning of garbage in the property was the second most common form of waste disposal.

All Major Regions recorded an increase in possession of mobile telephones
Between 2016 and 2017, there was a slight positive change (from 92.3% to 92.7%) in the proportion of housing units in the country where at least one resident had a mobile telephone, whereas landline telephony fell from 34.5% to 32.1%. The presence of a mobile telephone recorded its smallest percentages in the North (88.8%) and Northeast (89.1%). The Southeast (93.9%), South (95.0%) and Central West (96.9%) recorded percentages above 90%. The existence of a landline telephone, in turn, accounted for the biggest regional difference: the Southeast recorded the biggest proportion (47.0%), followed by the South (35.8%) and by the Central West (29.0%). The Northeast (12.6%) and North (10.6%) recorded the smallest proportions. Mobile telephony recorded increase in all the Major Regions between 2016 and 2017, with the Northeast as a highlight (from 88.1% to 88.8%). On the other hand, landline telephony fell from 50.0% to 47.0%, in the Southeast.
The refrigerator was another item found in most housing units, a total 98.1%. In the Major Regions, there was no percentage below 90%, with a change from 93.2%, in the North, to 99.3%, in the Southeast, and 99.4% in the South Region.
The ownership of washing machines recorded the biggest differences among the Major Regions, being present in 63.8% of the housing units in the country. The smallest percentage was registered in the Northeast (34.3%), followed by the North (40.8%). That good was mostly present in the South (84.4%), Southeast (7.6%) and Central West (68.8%).
In 2017, 96.8% of the housing units had a television set in Brazil (in 2016 that percentage was 97.4%). The proportion ranged between 92.8%, in the North Region, to 97.9%, in the Southeast. In all the Major Regions, the percentage of housing units with a television set fell, being the main decrease that of the North, from 93.9% to 92.8%.
In Brazil, 44.0% of the housing units had a personal computer in 2017, including portable ones, whereas, in 2016, that percentage was 46.2%. The Southeast Region recorded the biggest percentage (52.2%), followed by the South (51.5%); Central West (46.2%); Northeast (29.9%) and North (28.2%). All the Major Regions recorded a decrease in comparison with 2016 figures.
In Brazil, there was a car in 47.6% of the housing units; a motorcycle in 22.4%, and both, in 10.8%. The South Region recorded the biggest percentage of car ownership (67.5%), whereas, in the North (26.9%) and the Northeast (27.0%) recorded the smallest proportions in this respect and were the only ones to have percentages of motorcycle onwnership (32.6% and 29.8%, respectively) above those of car ownership. The Central West, on the other hand, had the biggest proportion of ownership of both items (15.8%). All the Major Regions recorded an increase of the number of housing units with a car or motorcycle between 2016 and 2017.
Brazilian resident population Pwas estimated at 207.1 million persons
In 2017, the resident poplationo of Brazil was estimated at 207.1 million persons, 4.2% bigger than in 2012, when that figure was 198.7 million. The Central West (7.6%) and North Regions (7.3%) accounted for the biggest population increases in the period, but had the smallest levels of participation in the otal population (7.6% and 8.5%, respectively). The Southeast Region, in turn. concentrated 42.0% of the resuident population. Whereas men made up 48.4% of the resident populayion, women accounted for 51.6%.
Group of persons aged 60 years of age and over increased from 12.8% to 14.6%
The age structure remained broad on top and narron at the bottom, making clear the tren to population aging. There was decrease of the percentage of men in almost all the age groups up to the age bracket of 34, except for the group aged 20 to 24, which fell up to 2016 (from 8.3% to 7.9%), but recorded slight increase in 2017 (8.2%); and increase starting in the group aged 35 to 39. Among women, there was decrease o percentages up to the age 30 to 34, and increase in the other age brackets.
The male population had a younger profile than the female one: men aged up to 24 made up 18.7% (20.0% in 2012) of the total in 2017, whereas women, 17.9% (19.5% in 2012). On the other hand, men aged 60 and over were 6.4% of he population in 2017 (5.7% in 2012) and women in this group, 8.2% (7.2% in 2012).
Between 2012 and 2017, the group of persons aged 60 and over increased from 12.8% to 14.6%. The number of persons in this age group increased 18.8%. The group of children aged 0 to 9 in the resident population, however, fell from 14.1% to 13.0% in the period. There was a decrease of 3.6% of the number in this age group. In the North, 35.8% of the persons were under 20 years of age and 31.0% were in this group in the Northeast. These regions had recorded the most significant decreases in the population under 20 since 2012, in comparison with the others. A total 18.9% of the population in the Northeast Region was aged 50 and over, whereas 28.9% of the persons in the Southeast and 29.9% of those in the South were in this group.
Black and brown populations increased by 21.8% and 7.7%
The self-declared white population was 90.4 million persons in 2017, a decrease of 2.4% in comparison with that of 2012 (92.6 million). On the other hand, black and brown populations increased 21.8% and 7.7%, respectively, in the period.
The white population, in 2017, represented 43.6% of the resident population, whereas the blacks made up 8.6% of the total, and brown persons, to 46.8%. In 2012, self-declared white persons made up 46.6%, whereas 45.3% were black and 7.4%, brown.
Striking regional differences were observed in the populayion's composition by color or race. In 2017, 75.6% of the population in the South Region reported being white; 19.6%, brown; and only 4.2%, black. On the other hand, in the North Region, 71.2% dof the population was brown; 20.1%, white and 7.1%, black. In the Southeast, withe the biggest resident population, 51.2% were white; 38.4%, brown and 9.3%, black.

