Continuous PNAD - ICT 2016: 94.2% of the persons who used the Internet did it to exchange messages


February 21, 2018 10h00 AM | Last Updated: March 02, 2018 06h21 PM
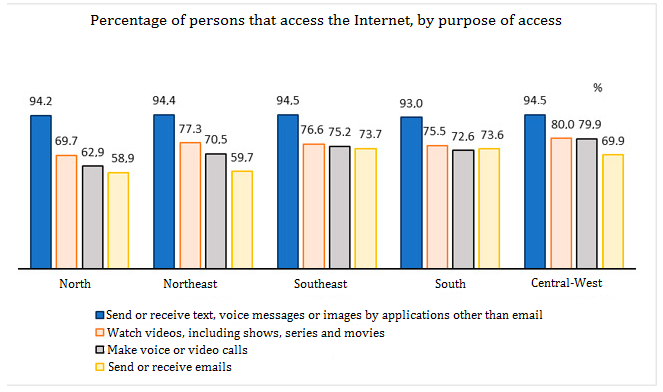
Among the Internet users aged 10 and over, in the reference period of the survey, 94.2% accessed the net to exchange text and voice messages or images through applications other than emails. Watching videos, shows, TV series and movies was the reason given by 76.4% of the users, followed by making voice or video calls (73.3%) and sending or receiving emails (69.3%).
Among the Internet users aged 10 and over, 94.6% were connected through a mobile cell phone.
Among the persons aged 14 and over who were employed, 75% used the Internet, whereas a little more than half (52.4%) of the non-employed accessed it.
Of the 63.4 million persons aged 10 and over that did not use the Internet, 37.8% did not know how to and 37.6% claimed lack of interest, while 14.3% did not access it because they considered the service expensive.
In the population aged 10 and over, 22.9% (41.1 million) did not have a mobile cell phone for personal use for the following reasons: considered the equipment expensive (25.9%), had no interest in it (22.1%), used someone else's mobile phone (20.6%) and did not know how to use it (19.6%)
The mobile cell phone was present at 92.6% of the 69.3 million households.
In 48.1 million households, there was Internet use, which represented 69.3% of the households.
In 97.2% of the households connected with Internet, the mobile phone was used to access it. Cell phones were the most used equipment for access in the households. In 38.6% of the houses, the mobile cell phone was the only equipment used to access the Internet. Next, came the computer: it was the only means of access in just 2.3% of the houses with Internet access, although it was present at more than half (57.8%) of the households.
In the households where there was not Internet use, the reasons alleged for not having it were: lack of interest (34.8%), expensive access service (29.6%), no resident knew how to use it (20.7%), non-available access service in the area (8.1%), expensive equipment required (3.5%) and other reasons (3.3%). Of the total of 69.3 million households, the TV set was present at 67.4 million (97.2%), with a total amount of 102.6 million sets. Out of them, 63.4% were thin screen and 36.6%, tube.
Among the households with TVs, 48.2 million (71.5%) had a converter to receive the digital signal for open TV. In 10.3% (6.9 million) of the households with TV sets, there were neither sets with converters, parabolic antennas nor pay TV services. In the households with TVs without access to pay TV services, more than half (55.5%) did not have them because they were considered expensive.
The complete publication, presentation and table plan of the Continuous PNAD - ICT 2016: Internet and TV access and ownership of mobile cell phones for personal use are on the right of this page.
Internet access boosted among persons aged 18 to 24
Of the 179.4 million persons aged 10 and over, 64.7% used the Internet at least once in the 90-day period before the interview in the surveyed households in the last quarter of 2016. The lowest percentages were in the Northeast (52.3%) and North (54.3%), and the biggest, in the Southeast (72.3%), Central-West (71.8%) and South (67.9%).
The Internet use increased according to the age, reaching the top among persons aged 18 to 24 to decline in the following groups. The percentage of persons aged 10 to 24 that used the Internet was: 66.3% in the group 10 to 13 years old, 82.5%, in the group 14 to 17, 85.4%, in the group 18 or 19 years old, 85,2%, in the group 20 to 24. Among the elderly (60 years old and older) just 24.7% accessed it. Such behavior was observed both in the indicators for men and for women, but the female share surpassed the male one in all age groups, except for the elderly.
In the male contingent, the share that used the Internet represented 63.8% and, in the female one, 65.5%. There was not a significant difference in this indicator for men and women in the South and Southeast; in the other Major Regions, women surpassed men.
One fourth of students in public schools did not access the Internet
Of the 37.2 million students aged 10 and over, 81.2% used the Internet. This result falls to 60.4% among those who were not students. In public schools, 75.0% of the students accessed the Internet, against 97.4% of students in private schools.
Internet use increased according to the schooling level of the persons ages 10 and over, reaching the top with incomplete higher degree: uneducated (11.2%), incomplete basic education (43.6%), incomplete higher education (97.1%) and complete higher education (95.7%).
More than half (52.4%) of non-employed persons did not use the Internet
Among the persons aged 14 or over who were employed, 75% used the Internet, whereas a little more than half (52.4%) of the non-employed accessed it. Of the 10 population groups, the Internet is most used among science professionals and intellectuals (97.4%), members of the military forces, policemen and fire fighters (96.8%), workers of administrative support (94.9%), secondary education professionals and technicians (94.3%) and directors and managers (93.3%). Qualified workers of agriculture, forest, hunt and fisheries (27.0%) are the ones with the lowest access.
In the comparison by the groups, of the 11 activities, Internet access achieved the highest figure in information, communication and financial activities, real estate, professional and administrative activities (92.0%), of education, human health and social services (91.2%), public administration, defense and social security (88.3%) and other services (87.6%) Agriculture, livestock, forestry, fishing and aquiculture (28.3%) was the group of activity with the lowest use of Internet.
In the categories of employment type, employers (87.8%) are the ones with the highest level of Internet use, followed by employees (80.1%), self-employed (60.7%) and contributing family workers (47.9%). In all Major Regions this behavior occurred, except for the North, where the percentage of employees (72.9%) was practically the same as that of employers (73.1%).
Nearly 95% of the persons who accessed the Internet used mobile phones
In the population aged 10 and over that used the Internet, 94.6% did it through cell phones, 63.7% though personal computers, 16.4% through tablets, 11.3% through TV sets and less than 1% through other electronic devices. Almost 33.4% of the Internet users had just mobile cell phones as a way of access, 4.4%, just the personal computer, 0.3%, just tablets and 0.1%, just TV sets.
Broadband was used by almost everyone (99.6%) using the Internet
Broadband, fixed or mobile, was used by 99.6% of the population aged 10 and over, while just 0.9% accessed it though dialed connection. Fixed-line broadband was used by 81.0% of those persons and mobile, by 76.9%. Of the one-type access, 21.5% just had it through fixed-line broadband and 17.4% just through mobile broadband.
The North had the lowest percentage of persons connected to the Internet via fixed-line broadband (63.3%), however, it had the largest proportion of access via mobile broadband (85.1%). In the Northeast, the opposite occurred: 65.1% used it through mobile broadband and 81.4%, through fixed-line broadband.
In the other Major Regions, mobile broadband access was 75.6% in the South, 80.6% in the Southeast and 82.9% in the Central-West. For fixed-line broadband, the figures were the following: Central-West (81.7%), South (81.9%), and Southeast (82.9%).
Nearly 95% of persons used the Internet to exchange messages
As to the purposes of use, 94.2% the persons aged 10 and over used it to exchange text, voice messages or images through applications other than the email. Watching videos, shows, TV series and movies was the reason given by 76.4% of this amount of persons, followed by making voice or video calls (73.3%) and sending or receiving emails (69.3%).
In the Northeast, 40% of those who did not use the Internet alleged not knowing how to
Of the 63.4 million persons aged 10 and over that did not use the Internet, 37.8% did not know how to and 37.6% claimed lack of interest, while 14.3% did not access it because they considered the service expensive. The other answers (service unavailable, expensive electronic device and other reasons) were below 6%.
Among the persons that did not use the Internet, the Northeast presented the highest percentage (40.0%) of those who did not know how to.
Among the uneducated persons aged 10 and over, 60.7% did not know how to use it and 24.4% were not interested in accessing it. For those with complete higher education, 20.9% did not know how to use the Internet and 59.3% were not interested.
Nearly 70% of households had Internet access
The Internet was used in 69.3% of the households. Web access was present in most of the households in all Major Regions: 76.7% in the Southeast, 74.7% in the Central-West, 71.3% in the South, 62.4% in the North and 56.6% in the Northeast.
In the households where the Internet was not used, the main reasons were: lack of interest (34.8%), expensive service (29.6%) and no resident knew how to use it (20.7%). Among the residences that did not use the Internet, the non-availability of the Internet recorded 8.1% and the cost of the equipment, 3.5%.
Regionally, the main reasons for not using the Internet was the lack of interest, except in the Northeast, where it was behind expensive service (34.8%). In the North, the second reason was the non-availability of web access in the area (24.4%), a higher percentage than in the other Major Regions, which ranged from 9.8% (Central-West) to 4.2% (Southeast). With the exception of the North, the absence of one who knew how to use the Internet was the third more given reason, from 20.3% (Southeast) to 22.5% (Central-West).
Cell phones were the most used means of access in households
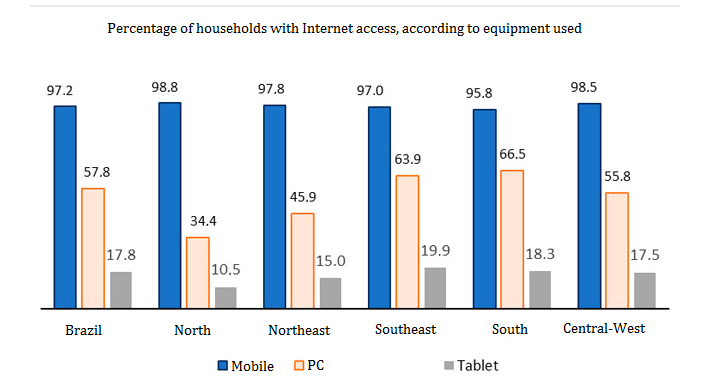
The most used equipment to access the Internet in the household was the mobile cell phone (97.2%), present at 46.7 million households, it was the only means used for this end in 38.6% of the residences with access. Next, came the computer: it was the only means of access in just 2.3% of the houses with Internet services, while it was present at more than half (57.8%) of those households. Meanwhile, the tablet stood on the third position (17.8%) followed by the TV (11.7%) and other equipment (1.3%).
In the Major Regions, the use of the cell phone to access the Internet varied from 95.8% (South) to 98.8% (North) of the households with access to the web. Among the households with Internet, the use of the personal computer to access the web varied from 34.4% (North) and 66.5% (South). In relation to tablets, this indicator changed from 10.5% (North) to 19.9% (Southeast), whereas for TV, it ranged from 4.8% (North) to 14.4% (South).
Broadband was used by almost every household (99.7%) with Internet services
The broadband connection was used in almost all the households with Internet (99.7%), whereas the dialed access was used only in 0.6% of the houses. In relation to the type of broadband, the mobile kind (3G or 4G) was in 77.3% of the households with Internet access, whereas the fixed-line kind, in 71.4%. The former was the only one used in 26.7% of the houses and the latter, in 21.2%
In the North, the connection through mobile broadband (88.2%) was almost twice as the fixed-line one (44.9%) – the greatest difference among the Major Regions. The fixed-line broadband only surpassed the mobile one in the South (75.3% against 74.0%) and Northeast (69.6% against 68.3%).
In almost half (49.1%) of the households with Internet access, there were the two kinds of broadband. The use of both types was lower in the North (33.5%) and in the Northeast (38.2%), and covered at least half of the households in the other Major Regions.
Approximately 3/4 of the population aged 10 and over had cell phones
Of the population aged 10 and over, 77.1% had cell phones for personal use. The indicator varied from 65.1% (North) to 84.6% (Central-West). The proportion of men who had a cell phone for personal use (75.9%) was lower than that of women (78.2%). This difference was noticed in the North (62.3% against 67.8%), Northeast (65.5% against 71.6%) and Central-West (83.6% against 85.6%), but almost imperceptible in the other Regions. Among cell phone users, 78.9% accessed the Internet by means of the device.
The percentage of cell phone users (personal use) was lower in the age group of 10 to 13 years old (39.8%), increased in the group of 14 to 17 (70.0%) and reached the greatest levels among persons aged 25 to 34 (88.6%) and 35 to 39 years old (88.2%), then falling in the following groups to reach 60.9% among the elderly (60 years old or older).
In the group of women 10 to 13 years old, the percentage of those who had a mobile phone (42.9%) was bigger than that of men (36.9%). The oldest the age, the lowest the differences. Positions are inverted in the group aged 60 and older, where men (62.3%) surpassed women (59.8%).
Among the population of non-students, the share that had mobile cell phones for personal use achieved 79.5%, above that of students (68.0%). However, public school students reached a very much lower level (59.4%) than private ones (90.3%).
The percentage of persons who had a mobile cell phone for personal use grew according to schooling. This indicator ranged between 43.6% (uneducated) and 97.5% (complete higher education).
According to the employment type of the population aged 14 and over, the employed had a higher percentage of those who had cell phones for personal use (88.9%) in relation to the non-employed (69.1%). Among the employed persons who had a cell phone for personal use, the percentage of those who had access to the Internet through the device was higher (83.2%) than the non-employed (71.1%).
As to the employment type, the contributing family workers had the lowest percentage of persons with the mobile cell phones for personal use (64.3%), below that of that of the self-employed (83.2%), employees (91.3%) and employers (96.6%).
Price was the major reason for 25.9% of the persons aged 10 and over not to have a mobile cell phone
Among the population aged 10 and over, 22.9% did not have a mobile cell phone for personal use. Among the reason not to, the highlights were: equipment price (25.9%), lack of interest (22.1%), used someone else's cell phone (20.6%) and did not know how to use it (19.6%). Regionally, the major reason ranged from the cost of the device (North and Northeast), someone else's device (South and Central-West) and lack of interest (Southeast). In the North Region, 12.5% said that the service was not available in the places where they hang out, which did not reach 5% in the other Major Regions.
Nearly half (45.3%) of the households had a personal computer
Of the total households (69.3 million), 45.3% had a personal computer. The lowest percentages were in the North (28.1%) and in the Northeast (29.9%) whereas the highest were in the Central-West (47.4%), Southeast (54.2%) and South (53.5%).
As to tablets, the equipment was present at 15.1% of the households, with the highest percentage in the Southeast (18.2%), and the lowest in the North (9.3%).
Cell phones in 92.6% of the households, whereas landline phones in 33.6%
In just 5.4% of the households there were not any types of phones. The absence was more intense in the households of the North (10.7%) and Northeast (10.0%), followed by the Southeast (3.2%), South (3.0%) and Central-West (2.4%).
There were cell phones in 92.6% of the households. In the Major Regions, the percentage of households with the device ranged between 88.7%, in the North, and 96.8%, in the Central-West. Landline telephones were present at nearly one third of the households (33.6%), with the highest percentage in the Southeast (49.1%) and the lowest (11.5%), in the North.
Just 2.0% of the households had just landline phones, whereas 60.9% had just cell phones. In the North, this indicator was 77.8%, and 47.7% in the Southeast.
Television was present at 97.2% of the households
Of the 69.3 million households, just 2.8% did not have television sets. The North recorded the highest percentage of households in that situation (6.3%), followed by the Northeast (3.8%) and the Central-West (3.1%). In the other two Regions, the percentage stood below the national result (2.8%).
Tube TVs are no longer manufactured in the country, but they are still present at 46.2% of the households, varying from 41.1% in the Southeast to 54.3% in the Northeast. The percentage of households with thin screen (LED, LCD or plasma) was of 66.8%. The highest percentage was in the Southeast (73.8%) and the lowest, in the Northeast (54.2%).
In the 67.3 households with television, there were 102.6 million sets, of which 63.4% were thin screen and 36.6% were tube. In the country, 13.0% of the households with TV had sets of both types (tube and thin screen). This percentage reached the highest level in the South (18.9%), followed by the Southeast (14.9%), ranging between 8.5% and 9.7% in the other areas. In the households with TVs, the share of those where there was just the thin screen model surpassed that of those with just tube in all Major Regions, except in the Northeast, where results were practically the same (45.7% and 45.8%, respectively).
More than 48 million households had a converter to receive digital signal for open TV
The survey showed that there was TV with converters (integrated or adapted) to receive the digital signal for open TV, even when not receiving it, in 48.2 million households (71.5% of the households with TV). In the Northeast, this indicator stood at 59.1% and, in the North, at 62.7%. The results stood around 75% in the South and Central-West, and reached 78.6% in the Southeast.
Of the 67.4 million households with a TV set, those who had a converter already receiving a digital signal for open TV represented 57.3%. Among the Major Regions, the highest result was in the Southeast (66.1%), followed by Central-West (61.8%), South (58.9%), North (46.3%) and Northeast (43.3%).
In the households where there were only thin screen TVs, 92.7% had the set with a converter. In households with just tube TV, 29.3% had the converter.
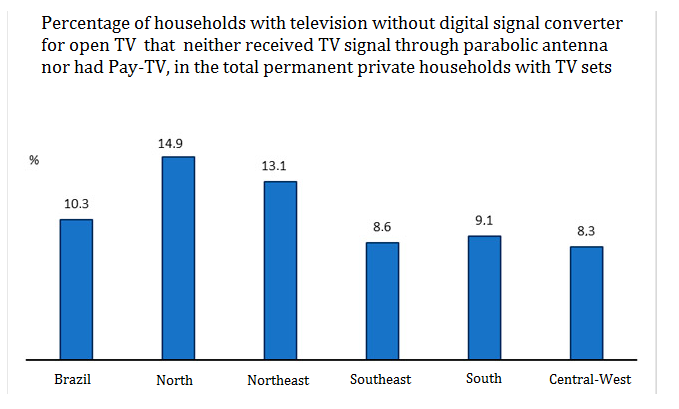
Households with TVs without converters that did not receive that signal though parabolic antenna neither had pay TV services were 6.9 million, representing 10.3% of the households with TV. The percentage of households without any of the three conditions that make the access to open TV signals possible, in the total of households with TV sets, was higher in the North (14.9%) and Northeast (13.1%).
More than half of the households without pay TV did not hire the service because of price
The households with TVs with parabolic antenna represented 34.8% of the households with TVs.
Pay TV services were used in 33.7% of the households with TVs. The greatest differences are among the Major Regions: Northeast (18.4%) and North (21.0%), which recorded the lowest percentages, and Southeast (44.8%), which reached the highest one.
Of the households with sets without pay TV services, more than half (55.5%) did not have them because they were considered expensive. The second reason was lack of interest (39.8%). Just 2.3% of those households did not have the service because of its unavailability in the household area.


