2015 GDP of Municipalities: participation of capital cities in the GDP records decrease


December 14, 2017 10h00 AM | Last Updated: December 14, 2017 06h10 PM
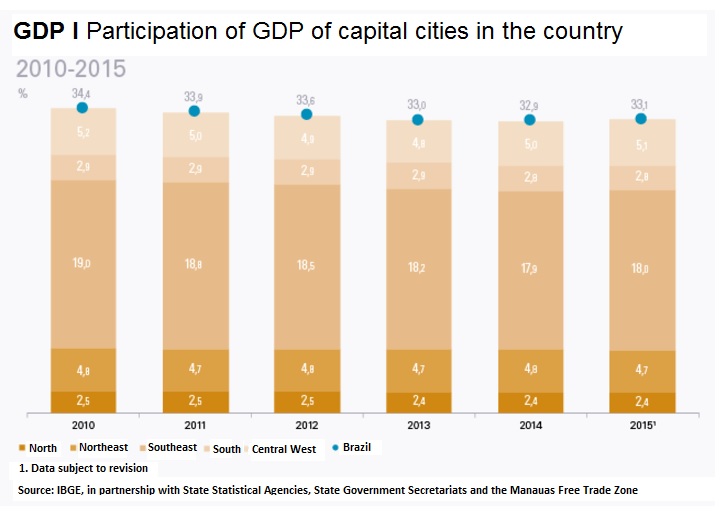
From 2002 to 2015, in 20 of the 26 Brazilian states, the participation of the GDP of capitals in the national figure recorded a decrease (-2.9 percentage points). The participation of municipalities out of the capitals rose from 63.9% to 66.9% of the GDP, with an increase of 2.9 percentage points in the period.
In 2015, seven municipalities (São Paulo, Rio de Janeiro, Brasília, Belo Horizonte, Curitiba, Porto Alegre and Manaus) concentrated about 25.0% of the country's GDP and 14.3% of the population. The first five ones have been on the same position in the ranking since 2010.
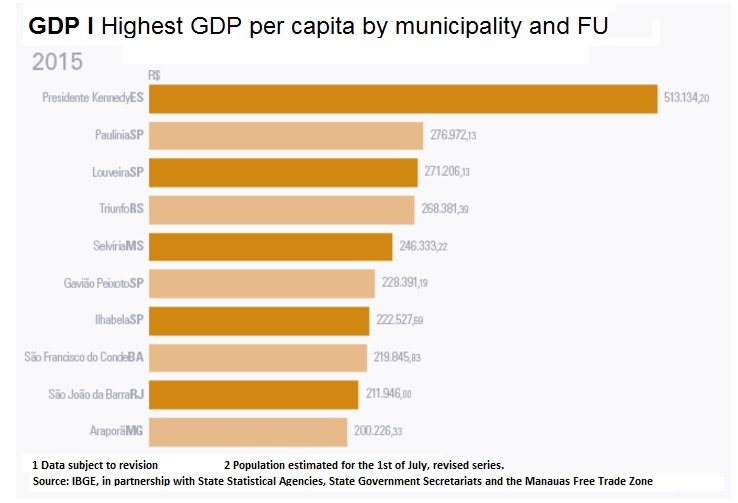
The ten municipalities with the highest per capita GDP accouted for 1.3% of the national GDP and only 0.1% of the countrys population, in 2015. The highest GDP per capita was that of Presidente Kennedy (ES), an oil producer, and the lowest figure came fom Novo Triunfo (BA).
Among the capitals, in 2015, São Paulo was in the first position regarding participation in the country's GDP, wheres Palmas was in the last position The 25 highest GDP figures had 37.7% of participation in GDP and only 23.5% of the population.
In 2015, in 3,170 municipalities (56.9% of the total) the main economic activity Administration, defense, public education and health and social security. Except for civil service, in 3,129 municipalities (56.2% of those in the country) Agriculture was the main economic activity. Click here to see the complete publication.
Municipalities out of capitals were responsible for 66.9% of the GDP in 2015
From 2002 to 2015, the participation of capitals’s GDPs in the national figure recorded decrease in 20 of the 26 states in Brazil. In 2002, 36.1% of the Brazilian GDP came from state capitals, a figure that, in 2015, changed to 33.1%, with a decrease of 2.9 percentage points. On the other hand, municipalities other than capitals were responsible for 63.9% of the GDP and their contributiin changed to 66.9%, an increase of 2.9 percentage points in the same period. From 2002 to 2014, there was bigger decrese of capital participation: 3.2 points.
In 2015, whereas São Paulo was in the first position in terms of contribution to the country's GDP, Palmas (TO) was in the last position. Florianópolis (SC) was the only capital not to be placed as number one in the ranking of GDP in its state, coming after Joinville, which is part of the mechanics/metal center in the stets, and after Itajaí, which stands out in terms of port activities, industry and other services.
| Table 6 - Goss Domestic Product of Capital Municipalities, by position in relation to capitals, to the Federation Unit and to Brazil, by Capital Municipalities and their respective Federation Units, in order of position - 2015 | ||||
|---|---|---|---|---|
| Capital Municipalities, in order of position |
Gross Domestic Product | |||
| Value (1 000 R$) |
Position in relation to | |||
| the Capitals | the Federation Unit | Brazil | ||
| São Paulo/SP | 650 544 789 | 1st | 1st | 1st |
| Rio de Janeiro/RJ | 320 774 459 | 2nd | 1st | 2nd |
| Brasília/DF | 215 613 025 | 3rd | 1st | 3rd |
| Belo Horizonte/MG | 87 364 598 | 4th | 1st | 4th |
| Curitiba/PR | 83 864 936 | 5th | 1st | 5th |
| Porto Alegre/RS | 68 117 224 | 6th | 1st | 6th |
| Manaus/AM | 67 066 846 | 7th | 1st | 7th |
| Salvador/BA | 57 872 793 | 8th | 1st | 9th |
| Fortaleza/CE | 57 246 034 | 9th | 1st | 10th |
| Recife/PE | 48 032 463 | 10th | 1st | 13th |
| Goiânia/GO | 46 632 596 | 11th | 1st | 15th |
| Belém/PA | 29 280 972 | 12th | 1st | 23rd |
| São Luís/MA | 26 832 481 | 13th | 1st | 26th |
| Campo Grande/MS | 24 257 415 | 14th | 1st | 31st |
| Vitória/ES | 23 041 070 | 15th | 1st | 33rd |
| Cuiabá/MT | 21 220 587 | 16th | 1st | 36th |
| Natal/RN | 20 904 276 | 17th | 1st | 37th |
| Maceió/AL | 20 681 597 | 18th | 1st | 39th |
| Florianópolis/SC | 18 636 407 | 19th | 3rd | 44th |
| João Pessoa/PB | 18 336 936 | 20th | 1st | 45th |
| Teresina/PI | 17 627 625 | 21st | 1st | 48th |
| Aracaju/SE | 15 672 677 | 22nd | 1st | 53rd |
| Porto Velho/RO | 13 946 784 | 23rd | 1st | 61st |
| Macapá/AP | 9 085 050 | 24th | 1st | 95th |
| Rio Branco/AC | 8 266 473 | 25th | 1st | 105th |
| Boa Vista/RR | 7 559 301 | 26th | 1st | 124th |
| Palmas/TO | 7 400 436 | 27th | 1st | 128th |
| Source: IBGE, em parceria com os Órgãos Estaduais de Estatística, Secretarias Estaduais de Governo e Superintendênciada Zona Franca de Manaus - SUFRAMA. | ||||
In Brazil, 25 municipalities hold about 37.7% of the country's GDP do PIB do Brasil
In Brazil, 25 municipalities concentrate 37.7% of participation in the country's GDP. On the contrary, 5545 share the remaining 62.3%. That group of the 25 highest GDP represent only 23.5% of the population.
In 2015, seven municipalities (capitals) held about 25.0% of the GDP in the country and 14.3% of the population. The first five municipalities in that group (São Paulo, Rio de Janeiro, Brasília, Belo Horizonte and Curitiba) had the same position in the ranking from 2010 to 2015. Among the 25 biggest GDP figures out of the Southeast Regions are all from capitals. Manaus and Belém, North Region, Salvador, Fortaleza and Recife, Northeast Region, Curitiba and Porto Alegre, in the South Region, and Brasília and Goiânia, in the Central West Region.
| Table 4 - Position of the seventh biggest municipalities in terms of GDP and percent participation in the Gross Domestic Product and in the population, by municipalities and respective Federation Units, by order of position -2015 | |||||||||||||
|---|---|---|---|---|---|---|---|---|---|---|---|---|---|
| Municipalities and respective Federation Units, in order of position in 2015 | Position in relation to the GDP of Brazil | Participation (%) | |||||||||||
| Gross Domestic Product | Popu-lation 2015 (2) |
||||||||||||
| 2010 | 2011 | 2012 | 2013 | 2014 | 2015 (1) | 2010 | 2011 | 2012 | 2013 | 2014 | 2015 (1) | ||
| São Paulo/SP | 1st | 1st | 1st | 1st | 1st | 1st | 11.6 | 11.5 | 11.2 | 10.9 | 10.8 | 10.9 | 5.9 |
| Rio de Janeiro/RJ | 2nd | 2nd | 2nd | 2nd | 2nd | 2nd | 5.4 | 5.2 | 5.3 | 5.3 | 5.2 | 5.3 | 3.2 |
| Brasília/DF | 3rd | 3rd | 3rd | 3rd | 3rd | 3rd | 3.7 | 3.5 | 3.4 | 3.3 | 3.4 | 3.6 | 1.4 |
| Belo Horizonte/MG | 4th | 4th | 4th | 4th | 4th | 4th | 1.5 | 1.5 | 1.6 | 1.5 | 1.5 | 1.5 | 1.2 |
| Curitiba/PR | 5th | 5th | 5th | 5th | 5th | 5th | 1.5 | 1.5 | 1.5 | 1.5 | 1.4 | 1.4 | 0.9 |
| Porto Alegre/RS | 8th | 8th | 8th | 8th | 7th | 6th | 1.1 | 1.1 | 1.1 | 1.1 | 1.1 | 1.1 | 0.7 |
| Manaus/AM | 6th | 6th | 7th | 6th | 6th | 7th | 1.3 | 1.3 | 1.2 | 1.2 | 1,2 | 1,1 | 1.0 |
| 1st to 7th 015 | 26.1 | 25.6 | 25.2 | 24.9 | 24.6 | 24.9 | 14.3 | ||||||
| Source: IBGE, em parceria com os Órgãos Estaduais de Estatística, Secretarias Estaduais de Governo e Superintendência da Zona Franca de Manaus - SUFRAMA. (1) Data subject to revision. (2) Population estimated for the 1st of July, revised series. |
|||||||||||||
In 2015, the 1,353 of the municipalities in the country with thesmallest GDPs accounted for approximately 1.0% of the national GDP and had 3.2% of the population. This range encompassed 73.2% of the municipalities in Piauí, 59.6% of the municipalities in Paraíba, 51.8% of the municipalities in Tocantins and 48.5% of those in Rio Grande do Norte.
Except for the capitals, ten municipaities generated, individually, more than 0.5% of the country's GDP and, together, accounted for 7,4% of the national GDP in 2015. The first seven ones are municipalities of São Paulo that have as main characteristic the integration between Industry and Services: Osasco, which generated 1.1% in 2015; Campinas and Guarulhos, with 0.9% each; Barueri, with 0.8%; São Bernardo do Campo and Jundiaí, with 0.7% each; and São José dos Campos, com 0,6%. Em seguida, estão os municípios do estado do Rio de Janeiro, Duque de Caxias e Campos dos Goytacazes, both with 0.6% each, and Sorocaba (SP) with 0.5%.
On the other hand, from the 25 smallest GDP figures in 2015, 16 come from the Northeat Region, 3 from the North, 4 from the Southeast and 2 from the Central West. All the the municipalities from the Southeast are located in the state of Minas Gerais.
Municipalities in the state of Rio de Janeiro reduce participation between 2014 and 2015
In relation to 2014, among the municipalities with the biggest level of participation in the GDP of Brazil, Brasília recorded the main advances. The increase in its participation is related to the activity of Administration, defense, public education and health and social security in the sector of Services. Paulínia (SP) gained participation due to the recovery of refining industry. Rio de Janeiro, to the expansion o Services, and the municipality of Canoas (RS) and Cubatão (SP) advanced beacuse of refining industry.
The municipalities of of Campos dos Goytacazes, Cabo Frio and Rio das Ostras, located in the state of Rio de Janeiro, had their participation redduced because of the results of oil and gas extraction. The car industry, on the other hand, was the main responsible for the reduced participation of São Bernardo do Campo (SP). In Parauapebas (PA), the decrease of participation resulted from the international prices of iron ore in mining and quarrying industry.
As for the less economically powerful municipalities, the biggest advance in 2015 versus 2014 occurred in Gavião Peixoto (SP) due to the production of transportation equipment of mining and quarrying industry. In Roque Gonzales and Alpestre, in Rio Grande do Sul, and Pedra Grande (RN), there was increase in the segment of generation of electricity. Finally, the oil refining industry was responsible for the increase in Guamaré (RN).
The municipalities of Cruzeta (RN) and Itatiaiuçu (MG) recorded decrease of participation due to the prices of iron ore. In Estrela do Sul (MG), the weak performance of silviculture was responsible for the decrease of the participation of that municipality. The deceleration in the sector of machinery and equipment had some negative effect on the municipality of Bodó (RN). In Barra do Rocha (BA), retraction in the activity of Construction was responsible for the fall of the economic participation.
Public administration was the main economic activity in 56.9% of the municipalities
In 2015, in 3,170 municipalities (56.9% of the Brazilian municipalities), the predominant economic activity was Administration, defense, public education and health and social security. More than 90% of the municipalities in the states of Paraíba, Amapá, Roraima, Piauí and Ceará had that profile, and, on the other hand, about 11% of the municipalities in the South Region had that characteristic.
Except for civil service, in 3,129 municipalities (56.2% of the municipalities in the country), Agriculture was the main economic activity. In 1,468 municipalities (26.4%), the main activity was Trade and repair of motor vehicles and motorcycles or Other services. In 973 municipalities (17.5%) the biggest activity was one of the four segments of Industry.
In comparison with 2010,results show that 80.0% of the municipalities kept that economic profile.
In 2015, Presidente Kennedy (ES) had the highest GDP per capita, and Novo Triunfo (BA), the lowest
In 2015, more than 30% of the municipalities in the state of Rio de Janeiro, Santa Catarina, Rio Grande do Sul, Mato Grosso do Sul and Mato Grosso had GDP per capita above that of the country (R$ 29,323.58). On the contrary, none of the municipalities in the states of Acre and Roraima had that characteristic. In the North and Northeast, the number of municipalities with GDp per capita above the nationa figure did not surpass 6.7%.
The 10 municipalities with the biggest GDP per capita (graph 6) had low population density. Together, they made up 1.3% of the Brazilian GDP but had only 0.1% of the population. As for the main economic activities developed, Presidente Kennedy (ES), São João da Barra (RJ) and Ilhabela (SP) were oil producers, and Paulínia (SP) and São Francisco do Conde (BA) had a refining industry.
Louveira (SP) concentrede distribution centers of major companies, and Triunfo (RS) was the headquarters of a petrochemical plant. Já Selvíria (MS) and Araporã (MG) had a hydroelectric plant, whereas Gavião Peixoto (SP) had the industryof other transportation material.
In Novo Triunfo (BA), the municipality with the lowest per capita GDP in 2015, (R$ 3,369.79), Administration, defense, public education and health and social security represented 65.7% of the total aggregarted value.