2022 Census
IBGE updates Statistical Grid with data from the Population Census


June 12, 2025 10h00 AM | Last Updated: June 14, 2025 01h27 AM
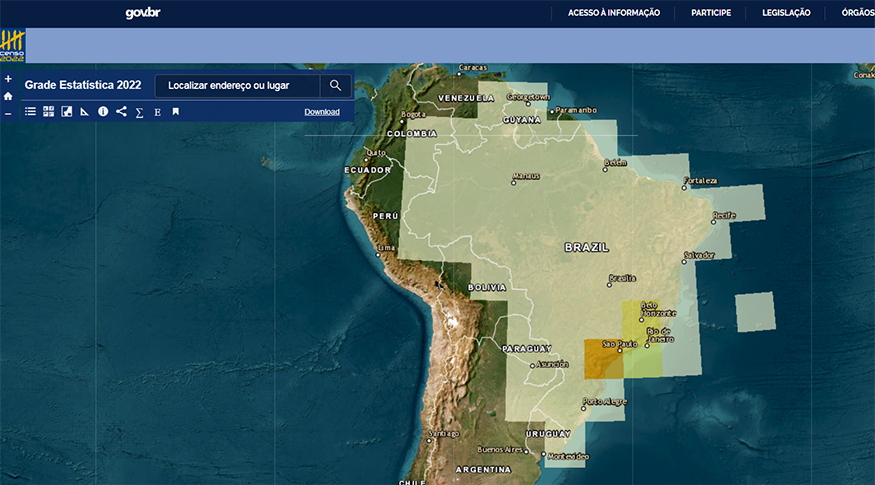
The Brazilian Institute of Geography and Statistics (IBGE) released today (12) the update of the Statistical Grid with data from the 2022 Demographic Census. The release replaces the 2010 version and presents a
new interactive tool that allows viewing age pyramids from any location on the map. Information is available for visualization through an interactive application and of vector files for download on the IBGE Portal.
Launched to become an alternative way of disseminating Census data, the Statistical Grid allows for greater detail and expands the possibilities for visualization and statistical analyses of data in comparison to traditional dissemination units, such as Enumeration Areas. Among the advantages are the regular shape, small size of the cells and their spatiotemporal stability, which allow for analyzes regardless of political-administrative boundaries and the composition of diverse spatial subdivisions.
“The area of Enumeration Areas Sectors changes over time, while the Statistical Grid has temporal and spatial stability, which allows areas to be reconstructed independently of these limits. So, if you have a natural area and an environmental accident occurs, you can assemble that area from these cells of the Statistical Grid and quantify, in a more direct way, the data from that area," explained the technical manager of the Statistical Grid, Ricardo Neves.
With the update, the total number of urban cells (200 m) in Brazil went from 4,610,350 in 2010 to 5,486,725 in 2022, an increase of approximately 19%, which reflects the expansion of urban areas in the country during this period.
The Statistical Grid is composed of square cells of 1 km in rural areas and of 200 meters in urban areas. The cells were updated following the update of the Mesh of Enumeration Areas for the 2022 Population Census. All 1 km cells existing in 2010 were maintained in the 2022 version, except for those that began to cover urban census sectors in 2022, which were divided into 200 meter cells. With the update, the total number of urban cells (200 m) in Brazil went from 4,610,350 in 2010 to 5,486,725 in 2022, an increase of approximately 19%, which reflects the expansion of urban areas in the country throughout this period.
In addition to the tool for data totalization by area, during the update the user can view the age pyramid interactively, simply by selecting the size of the circle and choosing a location on the map. Vector files (shapefile format) are available for download on the IBGE portal, in the original size (1 km and 200 m cells) and in the sizes of 1, 5, 10, 50, 100 and 500 km, for Brazil, recommended for use in geoprocessing software.
With the Statistical Grid, it is possible, for example, to identify the total population in areas vulnerable to floods and landslides, by overlaying population data with environmental layers, enabling more precise planning of evacuation and preventive actions. It can also be used as input for optimizing the location of health centers or schools, studies on the population's exposure to climate change, such as heat waves and rising sea levels, analysis of urban expansion and loss of native vegetation, among other applications.
The technician in charge of the product pointed out that Grid data can also be used in universities and to guide public policies: “a municipal manager who wants to understand the impact on an area where a project is built, the population affected or the population benefited, can easily use the application. The data can also be used for demographic research of all types, research that combines environmental data with demographic data, and for studies related to climate change. There is a series of information, which, depending on the type of use, the user will need iin order to access the data and work with it in a geoprocessing environment to conduct more advanced studies using this tool.”