POF
Households with up to 2 minimum wages spend 61% of budget with food, housing
October 04, 2019 10h00 AM | Last Updated: October 08, 2019 12h21 PM

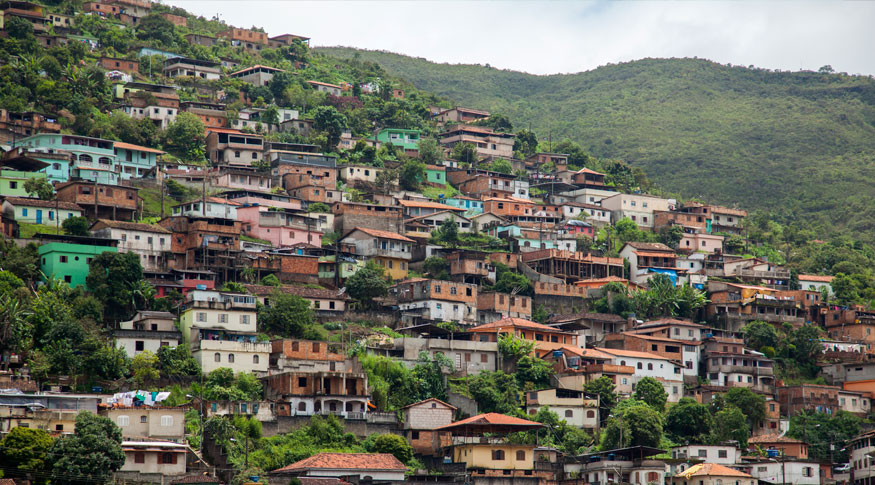
Poorer people commit nearly 40% of budget with food – Photo: Licia Rubinstein/IBGE News Agency
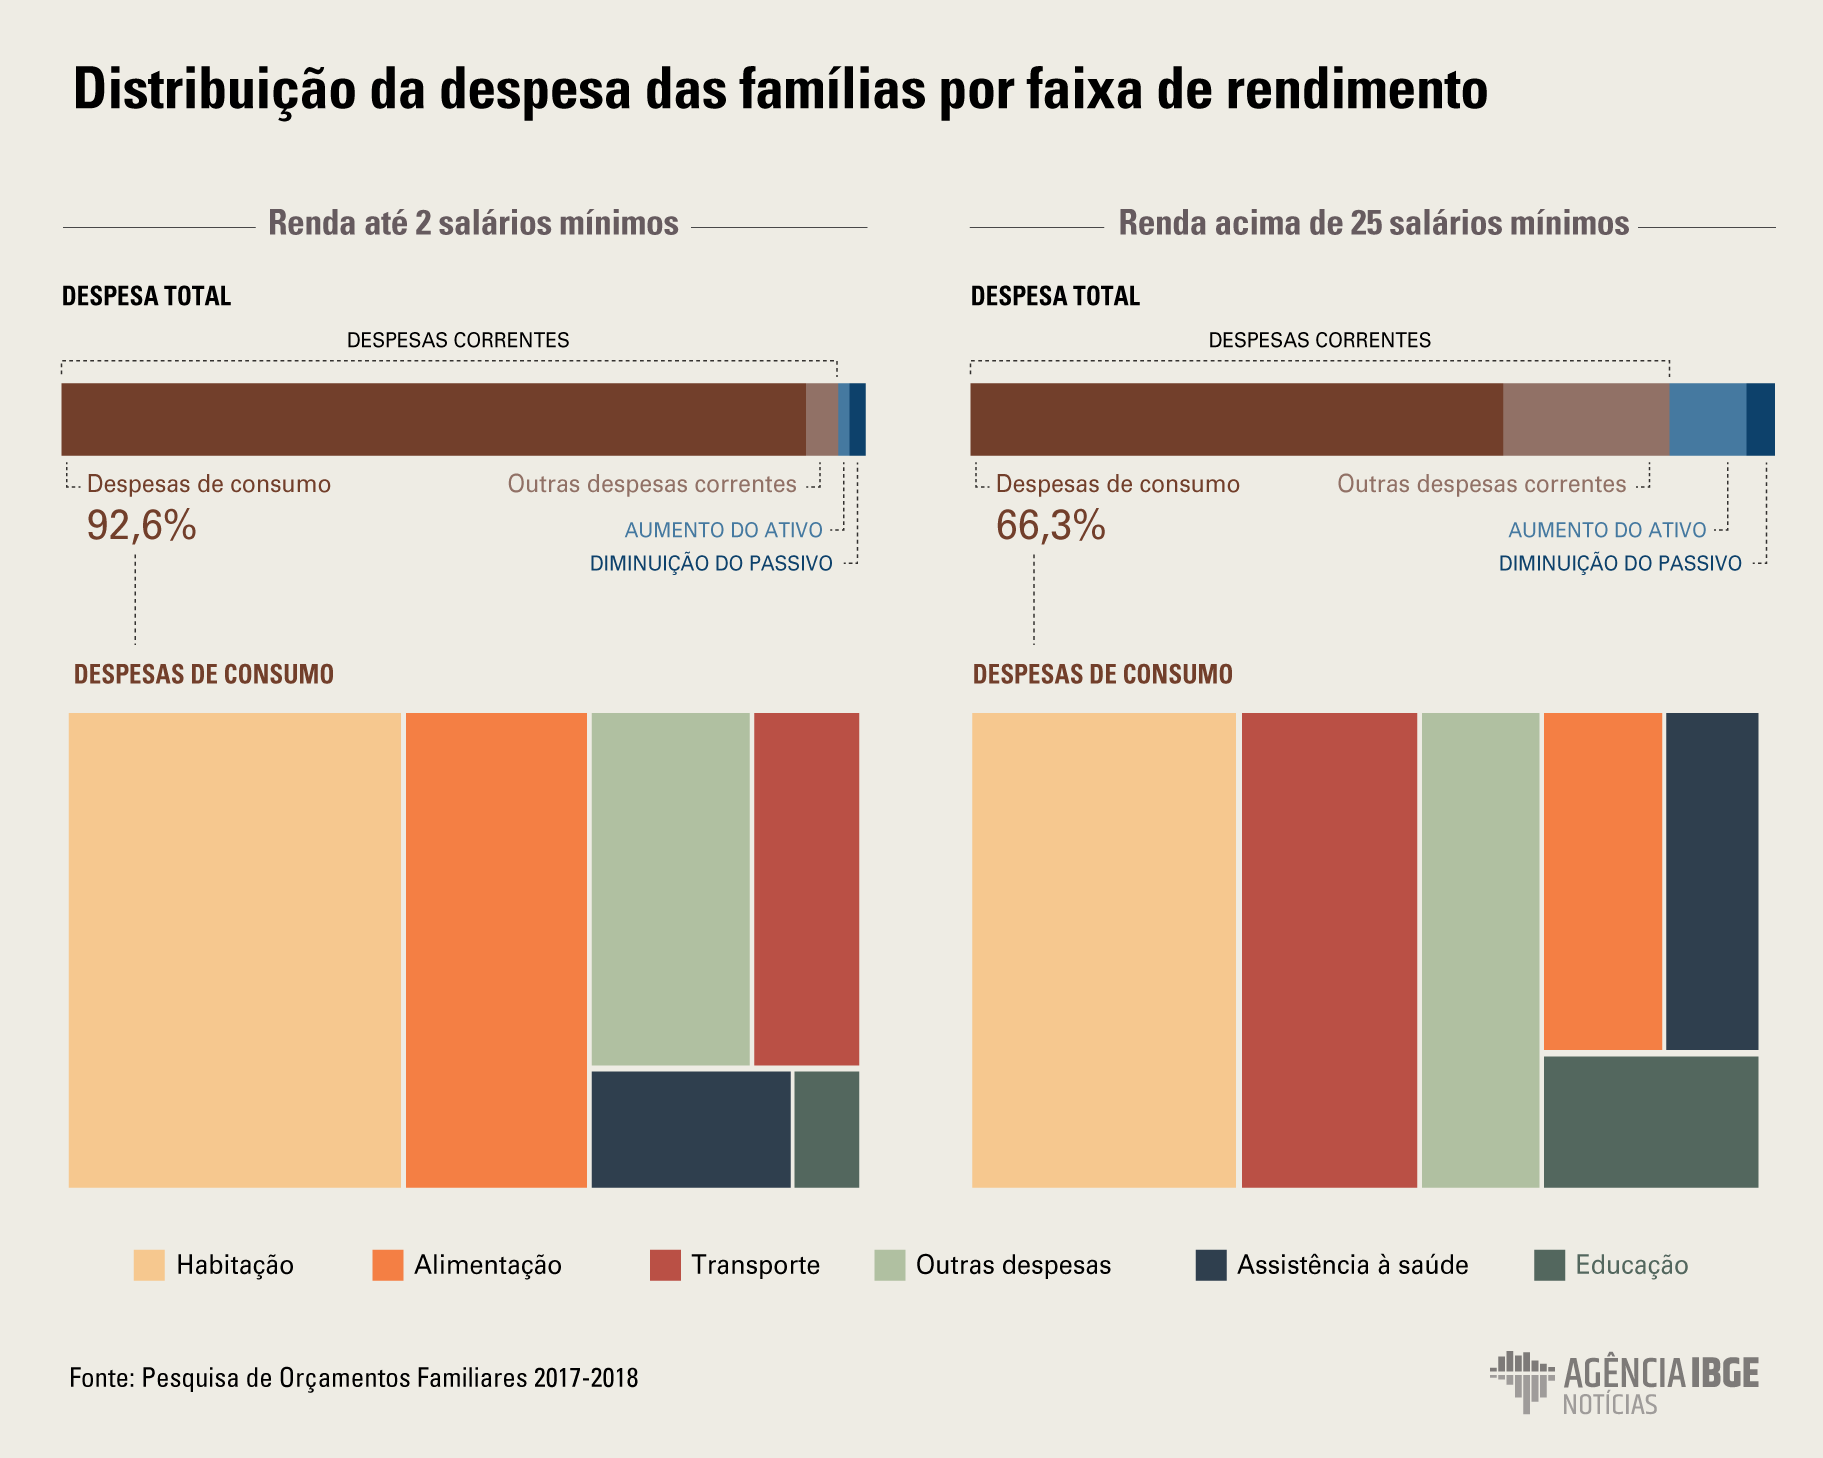
Households with income up to two minimum wages (R$1,908) commit great part of its budget with food and housing expenditures than households with earnings above 25 minimum wages (R$23,850).
Together, both groups represent 61.2% of household spending with less income, being 22% destined to food and 39.2% to housing expenditures. Regarding the households with higher income, the sum achieves 30.2%, being 7.6% destined to food and 22.6% to housing expenditures.
This is indicated in the Consumer Expenditure Survey – POF 2017-2018, released today by the IBGE.
The survey manager, André Martins, says that “the understanding around the household budget, in terms of spending, changes according to the class of the household earnings”.
This is the case of food, for example. Households that represent the class with higher income spend with food (R$2,061.64), the triple of the average value of the total households in Brazil (R$658.23) and more than six times the class value with lower earnings (R$328.74). For Martins, when looking at expenditures, like health (6.5%), the percentage contribution is very similar between the both income extremes, but their values are of different types and levels. “Among households with higher earnings, those expenditures are destined to health insurance (2.9%). In households with lower income, the expenditures are with medicines (4.2%)”, he points out.

According to POF, food, housing and transportation committed, together, 72.2% of the Brazilian household spending, in the matter of the total consumption expenditure, which means, those destined to goods and services.
Regarding food, the proportion of the total rural household expenditures (23.8%) surpassed the urban household expenditures (16.9%), as well as the transportation expenditure (rural 20% and urban 17;9%). Education (4.7%) was the group that presented the most relevant difference among the contributions of urban housings (4.9%) and rural housings (2.3%).
Brazilians invest less and pay more debits
The outgoing participation destined to the increase in the asset value, like property acquisition and refurbishment, was 4.1% in relation to the total expenditure. This group had a slump in the almost past 30 years between the Endef (National Study of Household Expenditure), with 16.5%, and POF 2003, with 4.8%. In the latter period, the percentage has been presenting less changes, achieving 5.8% in 2009 and 4.1% in 2018.
Regarding the decrease in the liabilities, which includes payment of debts, interests and insurance with personal loan, showed less changes in the historical trend. After a maintenance in the participation in 2003 (2%) and 2009 (2.1%), the percentage is close to the Endef results, when it represented 3.6% of the total expenditures.
For the survey manager, “when comparing with Endef, we notice that the share destined to the increase in the asset value was bigger, when compared with the 2003 survey. From 2009 to 2018, we have seen a small increase in the expenditure for the payment of debts”.
As the current expenditures commit 92.7% of household expenditures, “the other share left is to split between investments and decreases in the liabilities”, concludes Martins, reminding that the current expenses include, besides the expenditures with consumption, taxes, labor contributions, bank services and pensions.
Brazilians spend an average of R$4.6 thousand per month
The household monthly total average expenditures in Brazil was of R$4,649.03 in 2018, being 7.2% higher in urban areas (R$4,985.39) and 45.3% lower in rural areas (R$2,543.15). The highest values were in the Central West (R$5,762.12) and Southeast (R$5,415.49). North (R$3,178.63) and Northeast (R$3,166.07) were under the average.
Martins says that “this survey works with monetary and non-monetary expenditures, which are the shares that the households acquire a certain product, without spending a certain value for that. And it has been having an importance around 18% in relation to the overall expenditures.”
In Brazil, the monetary expenditures, paid in cash, checks and cards, are 81.9% of the total. The non-monetary expenditures represent 18.1%, which are from own production, withdrawal from business, barters, donation and other ways of acquirement that not involve money payments.
The non-monetary expenditures have a bigger share in rural areas (22.5% against 17.7% in urban areas). The Central-West showed the lowest percentage (15.9%), while the highest was recorded in the North (19%).


