Continuous PNAD 2016: 10% of the population with the highest earnings concentrate almost half of the income


November 29, 2017 10h00 AM | Last Updated: February 02, 2018 11h14 AM
The real monthly household wage bill per capita was R$255.1 billion. The 10% with the lowest income in the population had a share of 0.8% of the wage bill, whereas the 10% with the highest income held 43.4%.
Among the 205.5 million residents in the country, 60.5% (124.4 million) had some kind of income. Of them, 42.4% (87.1 million) had job earnings and 24.0% (49.3 million) earned money from other sources. As to the monthly average income from all sources, which aggregates the income coming from all jobs and from other sources, it was 2,053. The Southeast recorded the highest figures (R$2,461), whereas the lowest ones were in the North (R$1,468) and in the Northeast (R$1,352). The 1% of workers with the highest income got R$27,085, on average, or 36.3 times more that the half with the lowest income from work (R$747).
Of the household monthly income per capita, 74.8% derive from work and 25.2% from other sources: retirement pensions or other pensions (18.7%); other income (3.2%); rent and lease (2.2%); and alimony, donation and allowance from for non-resident (1.1%).
The Gini index, which ranges from zero (perfect equality) to one (maximal inequality), of the real monthly household income was 0.549. Among the Major Regions, the lowest index was in the South (0.473) and the highest, in the Northeast (0.555).
The information can be found in the module Income from all sources of the Continuous National Household Sample Survey 2016.
Southeast concentrates more than half of the wage bill of the country
The actual monthly wage bill from all jobs of the employed was
R$191.0 billion, with an average income of R$2,149. The Southeast concentrated 53.0% of the total wage bill, followed by the South (17.0%), Northeast (15.6%), Central-West (8.9%) and North (5.5%).
The real monthly average income was of R$2.149, with the highest values in the Southeast (R$2,536), Central-West (R$2,432) and South (R$2,300), and the lowest ones in the North (R$1,567) and Northeast (R$1,427).
South has highest average income among the 50% with the lowest income
Among the employed population, considering the actual earnings from jobs, the 1% of workers with the highest earnings received, on average, R$27,085, which is 36.3 times higher than what half of the population that gets the lowest incomes earns: R$747.
In the regional comparison among the average income of the less remunerated half, the South recorded the highest average (R$949), which was equivalent to almost twice the average of the Northeast (R$485) and North (R$560).
Northeast is the region with the greatest income inequality
The Gini index, which goes from zero (perfect equality) to one (maximal inequality), of the household real monthly earnings per capita was 0.549. Among the major Regions, the index was of 0.473 in the South; 0.523 in the Central-West; 0.535 in the Southeast; 0.539 in the North; and 0.555 in the Northeast.
Considering the real monthly earnings from all jobs, of the employed population aged 14 or over, the Gini index was of 0.525. The most unequal region is the Northeast (0.545), as opposed to the South (0.465), the Central-West (0.493), the North (0.517) and the Southeast (0.520).
The household real average income per capita was of 1,242. North and Northeast recorded the lowest values (R$772) and the Southeast the highest (R$1,537).
Nearly 50 million persons have income from sources other than work
Of the total population (205.5 million persons), 60.5% (124.4 million persons) had some kind of income. Of them, 42.4% (87.1 million persons) had earnings from jobs and 24.0% (49.3 million) had income from other sources, including retirement pension and other pensions (13.9%); other income (7.7%); alimony, donation and allowance from non-resident (2.4%) and rent and lease (1.8%).
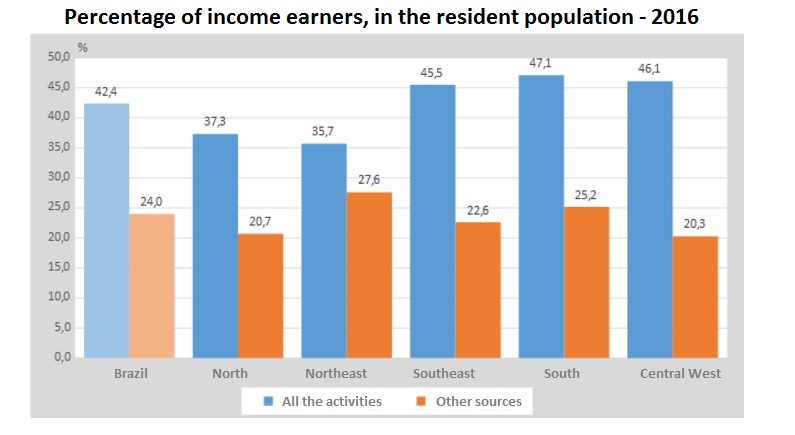
The Northeast has the greatest gap/unbalance between the income from all jobs and from other sources (retirement pension and other pensions; other income; rent and leasing; alimony, donation and allowance from non-resident). In this region, 27.6% of the resident population depends on other sources, the highest index among the regions, whereas just 35.7% have income from all jobs, the lowest percentage among the regions.
Retirement pension and pensions in general had the highest percentages among the Major Regions. The highlight was the South (17.3%), which also has the oldest population of the country, followed by the Southeast (15.0%), Northeast (13.1%), Central-West (10.8%) and North (8.0%).
Northeast has the lowest monthly average income from all sources
As to the monthly average income from all sources, which aggregates the earnings from all jobs and from other sources, it was R$2,053. The highest values occurred in the Southeast (R$ 2.461), followed by the Central-West (R$2,292), South (R$2,249), North (R$1,468) and Northeast (R$1,352).
Average real earnings from all jobs reached R$2,193. Northeast (R$1.473) and North (R$1,615) had the lowest values, whereas the highest was in the Southeast (R$2,573).
The monthly average income from other sources was of R$1,305. The lowest figure in the North (R$821), and the biggest in the Southeast (R$1,622). The other earnings (unemployment insurance, income transfer programs etc.) were, on average, R$516, with the highest value in the Southeast (R$784) and the lowest in the Northeast (R$347).
| Real monthly average income of the resident population, with actual earnings in the month of reference, at average prices of the previous year, by Major Regions, according to the type of income - 2016. | ||||||
|---|---|---|---|---|---|---|
| Type of income | Brazil | Major Regions | ||||
| North | Northeast | Southeast | South | Central-West | ||
| All sources¹ | 2 053 | 1 468 | 1 352 | 2 461 | 2 249 | 2 292 |
| All jobs¹ | 2 193 | 1 615 | 1 473 | 2 573 | 2 345 | 2 368 |
| Other sources | 1 305 | 821 | 892 | 1 622 | 1 481 | 1 528 |
| Retirement pension and other pensions | 1 670 | 1 334 | 1 371 | 1 834 | 1 653 | 2 064 |
| Rent and lease | 1 521 | 1 012 | 1 140 | 1 694 | 1 618 | 1 507 |
| Alimony, donation and allowance from non-resident | 576 | 491 | 375 | 717 | 624 | 623 |
| Other income | 516 | 380 | 347 | 784 | 640 | 573 |
Considering the monthly average household earnings per capita, 74.8% comes from work and 25.2% from other sources. The other sources comprise: retirement pensions or other pensions (18.7%); other earnings (3.2%); rent and leasing (2.2%); alimony, donation and allowance from non-resident (1.1%).
The real monthly household wage bill per capita was R$255.1 billion. The 10% with the lowest earnings in the population had a share of 0.8% of the wage bill, whereas the 10% with the highest earnings held 43.4% of the total. The Southeast, with R$132.7, presented the biggest wage bill, even above the sum of the other regions: Northeast (R$43.8 billion), South (R$43.5 billion), Central-West (R$21.8 billion) and North (R$13.4 billion).
Women's income is 22.9% lower than men's
In 2016, the Brazilian labor marker comprised 88.9 million of employed persons aged 14 or over.
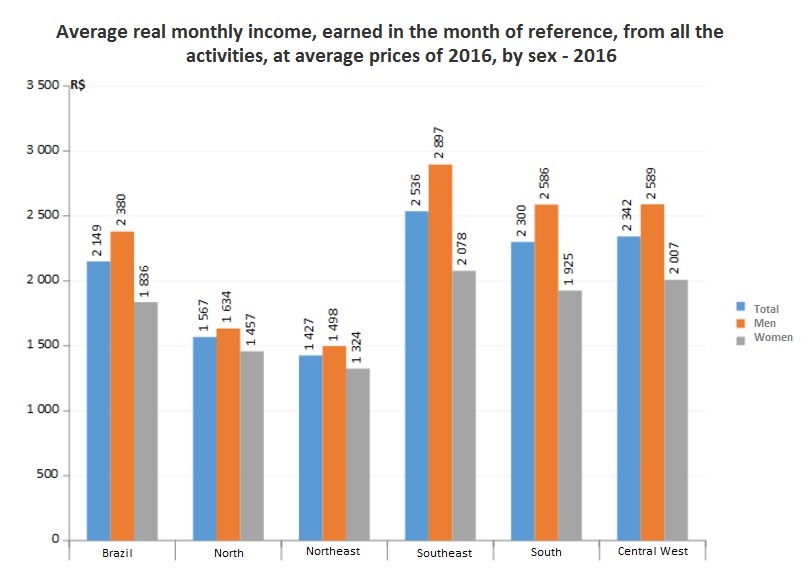
Among the employed population, the average monthly real income was R$2,149. Women earned an average of R$1,836, equivalent to 22.9% less than men (R$2,380). The Southeast had the highest average income for men (R$2,897) and women (R$2,078), but it had the highest inequality, with women getting 28.3% less than men. The North (R$1,567) and the Northeast (R$1,427), which have the lowest average income, had the lowest wage inequality, with women getting respectively 10.8% and 11.6%, less than the men.
Blacks’ and browns’ earnings, on average, are below national average
Among the employed population, the whites represented 46.6%, while the blacks, 9.0%, and the browns, 43.4%. The average income from all jobs of white persons (R$2,810) was approximately 45% higher than that of black people (R$1,547) and brown people (R$1,524).
The whites recorded earnings 30.8% higher than the national average (R$2,149), while blacks and browns had earnings, respectively, 28.0% and 29.1%, lower.
Workers with a degree earn three times more than secondary education workers
Considering the schooling of the employed population, workers with full higher education had an average monthly income of R$5,189, about three times more than those with only secondary education (R$1,716), and about six times higher than the uneducated ones (R$884).
The average income of uneducated workers (R$884) was 36.67% lower than of those with complete primary education (R$1,395).

