Triple Forum
In the Triple Forum, IBGE launches Statistical Grid with updated data of the 2022 Census


June 12, 2025 03h23 PM | Last Updated: June 17, 2025 01h10 AM

The Brazilian Institute of Geography and Statistics (IBGE) released today (12) the update of the Statistical Grid with data based on the 2022 Demographic Census, during the Triple Forum, which is organized by IBGE, in cooperation with Ceará State Government, from June 11 to 13, in Fortaleza, at the Ceará Events Center (Av. Washington Soares, 999, access to the west pavilion, gate C). Access the Statistical Grid.
Registration is still open. See the schedule on the event portal, whihc is supported by UN Development Programme (PNUD), do Banco do Nordeste do Brasil (BNB), United Nations Children’s Fund (UNICEF), Ceará Without Hunger, Company of Participation and Assets Management of Ceará S.A. (Ceará Par), Secretariat of Tourism of Ceará, National Secretariat of Youth - General Secretariat of the Presidency of the Republic and other partners. The plenary sessions will be broadcast live through Digital IBGE and other social media channels of the Institute: DigitaI IBGE, Youtube, Instagram, TikTok and Facebook.
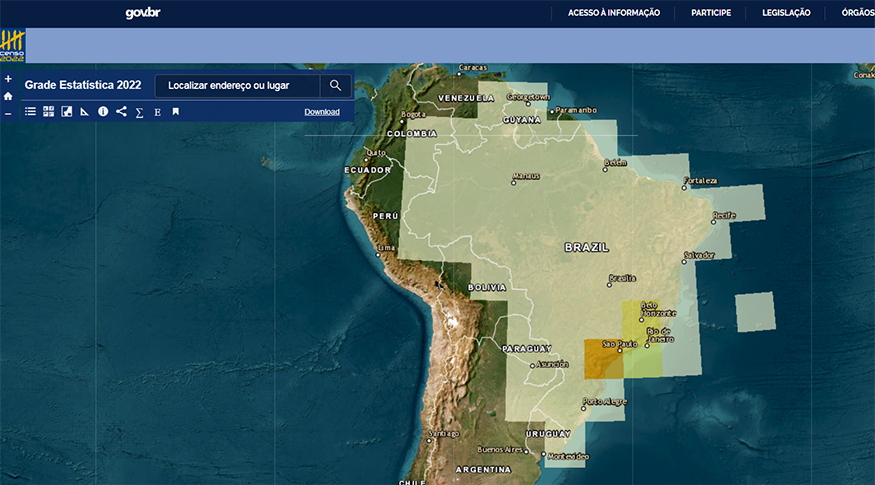
The new Statistical Grid replaces the 2010 version and features a new interactive tool that allows users to view age pyramids for any location on the map. The information is available for visualization through an interactive application and vector files for download on the IBGE Portal.
The new Statistical Grid replaces the 2010 version and features a new interactive tool that allows users to view age pyramids for any location on the map. The information is available for visualization through an interactive application and vector files for download on the IBGE Portal. The event was attended by the Director of Geosciences, Maria do Carmo Bueno; the Director of Surveys, Gustavo Junger; the Deputy Director of Geosciences, Gustavo Cayres; the Technical Coordinator of the Demographic Census, Giulia Scappini; and the Technical Manager for the Statistical Grid, Ricardo Neves.
“The data we provide in this section is limited, it is just the total population and households, but, despite being small, it is a very important section resulting from the integration of Geography and Statistics. The IBGE, together with the Institutes of Mexico and Liberia, are the only three Statistics Institutions in the world that have a geography department, geoinformation. It is very important for IBGE to establish integration and the Grid is a tool for this. The Integration of Geography and Statistics is not just about putting statistical data on the map, it is far beyond that. Putting statistical data into uniform cells like a Statistical Grid allows the user to make models and inferences. It is possible, for example, to use the data in population models, to see, for example, environmental accidents,” explained Maria do Carmo Bueno. Gustavo Cayres praised the product and highlighted that the announcement “reflects anxiety, an expectation for the launch of the product, and a great recognition of the significance of the Grid”.
Gustavo Junger highlighted that the Grid is a powerful tool for visualizing information in small sections and was developed at the Center for Documentation and Dissemination of Information (CDDI/IBGE). “The grid reflects data from the 2022 Demographic Census and is also important to remember how challenging it was to conduct the Census,” he pointed out.
“The Statistical Grid is a tool with great potential for presenting information in sections that go beyond the political-administrative sections,” reinforced the Technical Coordinator of the Population Census. She also thanked the technicians who updated and improved the Grid, the technicians who were part of the collection, validation, and processing, the State Superintendencies, and the Brazilian population: “you have allowed us to disclose such important data in different sections that are unique to geography and statistics for our entire country today.”
Ricardo Neves led the presentation of the Statistical Grid, and recalled the first version that was released in 2016, with data from the 2010 Population Census. He also presented the advantages of the Statistical Grid, which are: independence from operational and political-administrative limits; the possible composition of any spatial cutout; 1km cells that do not change over time, allowing direct comparison; regular distribution and computational efficiency; and a hierarchical structure that enhances multi-scale analyses.
About the Statistical Grid
By means of the Statistical Grid, it is possible to obtain customized analyses. For example, by selecting the desired areas, data can be obtained on the population of the biomes, hydrographic regions, relief units and climate zones found in the country.
The Statistical Grid also allows estimates of the population affected by climate or environmental disasters; it can also be used in simulation models of urban expansion or land use, among other technical uses. It also facilitates national and international comparison of data.
The product is developed based on numerical results from the Census and vector (spatial) data from the Territorial Base and the National Address List for Statistical Purposes (CNEFE).