IBGE presents an overview of urbanization in Brazil


June 20, 2018 10h00 AM | Last Updated: June 21, 2018 09h52 AM
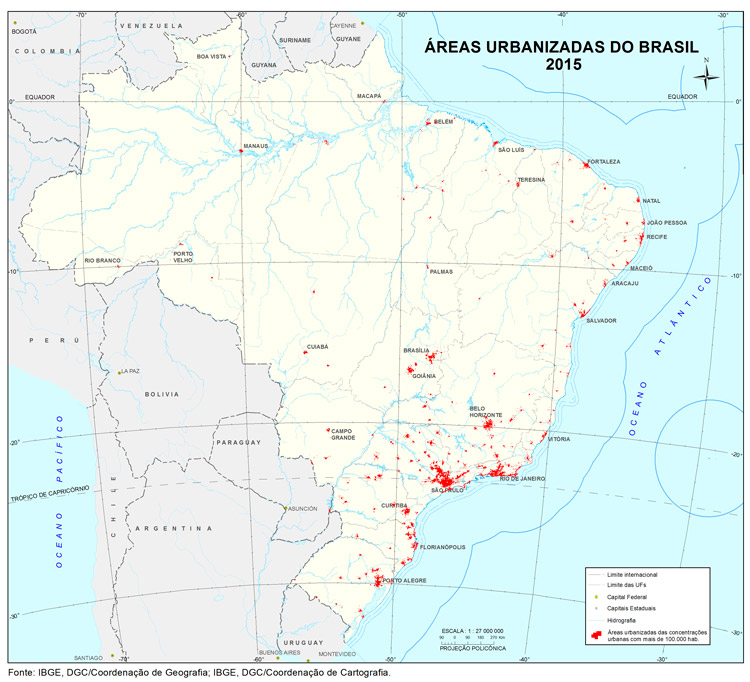
The IBGE today launches the second part of the publication Urbanized Areas of Brazil 2015, which encompasses urban concentrations with a population between 100 thousand and 300 thousand inhabitants. In this stage, the same methodological procedures of the first phase, dedicated to urban concentrations with population above 300 thousand inhabitants, were adopted. The objective of the project is to provide an overview of the country's urbanization process. The publication is aligned with the needs of the UN Sustainable Development Goals (ODSSDG).The database, maps, tables and the methodological report of this publication can be accessed in the column on the right of this page.
State of São Paulo has more urban concentrations
In its first stage, announced on July 27, 2017 (see the release), the project mapped 63 Brazilian urban concentrations with a population of more than 300 thousand inhabitants and the municipalities of Boa Vista (RR) and Palmas (TO), accounting for an area of 15,167.40 km².
In this second stage, 120 urban concentrations were mapped out in 22 Federation Units, totaling an area of 4,885.17 km². The states of Acre (AC), Amapá (AP), Sergipe (SE) and the Federal District (DF) did not present urban concentrations with population within the selected scope in this phase. Roraima (RR) had its single urban concentration with population above 100 thousand inhabitants (Boa Vista), as set in the previous stage, because it is the capital of the state.
The urban concentrations with the largest urbanized areas delimited in this stage of the project were Caraguatatuba/Ubatuba (SP), Itu/Salto (SP) and Cascavel (PR). The three lowest urban concentrations identified were Cametá (PA), Parintins (AM) and Abaetetuba (PA).
The state of São Paulo stands out for having 6 of the 10 urban concentrations of population between 100 thousand and 300 thousand inhabitants with the largest urbanized areas. The state is also highlihgt for having the highest number of urban concentrations of this same population level (26), followed by Minas Gerais, with 18 urban concentrations, and by Rio Grande do Sul, with 11.
| Areas of urbanized spots in municipalities with Concentration Areas with 100 000 to 300 000 inhabitants. according to density classification |
|||||
|---|---|---|---|---|---|
| Urban concentrations from 100 000 to 300 000 inhabitants | Area | ||||
| km² | Percentual (%) | ||||
| Total | Dense | Not so dense | Dense | Not so dense | |
| Total | 4885.17 | 4100.16 | 785.02 | 83.93 | 16.07 |
| Caraguatatuba/Ubatuba/SP | 114.41 | 109.08 | 5.33 | 95.34 | 4.66 |
| Itu/Salto/SP | 89.64 | 68.84 | 20.8 | 76.8 | 23.2 |
| Cascavel/PR | 86.71 | 80.25 | 6.46 | 92.55 | 7.45 |
| Araraquara/SP | 84.6 | 72.82 | 11.78 | 86.08 | 13.92 |
| São Carlos/SP | 81.59 | 66.93 | 14.66 | 82.03 | 17.97 |
| Limeira/SP | 76.68 | 59.92 | 16.76 | 78.14 | 21.86 |
| Araruama/RJ | 72.98 | 61.07 | 11.91 | 83.68 | 16.32 |
| Uberaba (MG) | 71.72 | 60.72 | 11 | 84.66 | 15.34 |
| Dourados (MS) | 71.24 | 60.05 | 11.19 | 84.29 | 15.71 |
| Mogi Guaçu/Mogi Mirim/SP | 70.38 | 57.42 | 12.96 | 81.59 | 18.41 |
Nine of the ten largest municipal urban areas are capitals
The results of the mapping of urbanized areas are also available for the municipal scale. In this level, the ten largest municipal urban areas, in ascending order, were São Paulo (SP), Rio de Janeiro (RJ), Brasília (DF), Curitiba (PR), Goiânia (GO), Belo Horizonte (CE), Manaus (AM), Campinas (SP) and Campo Grande (MS). Table 2 shows the 30 largest urbanized areas per municipality.
| Areas of urbanized spots in municipalities with Concentration Areas with more than 100 000 inhabitants. by density classification | |||||
|---|---|---|---|---|---|
| Municipalities | Area | ||||
| km² | Percentage (%) | ||||
| Total | Dense | Not so Dense | Dense | Not so Dense | |
| Total | 19992.33 | 17981.69 | 2010.68 | 89.94 | 10.06 |
| São Paulo (SP) | 897.78 | 882.36 | 15.42 | 98.28 | 1.72 |
| Rio de Janeiro (RJ) | 585.45 | 574.34 | 11.11 | 98.1 | 1.9 |
| Brasília (DF) | 509.05 | 475.32 | 33.73 | 93.37 | 6.63 |
| Curitiba (PR) | 309.45 | 304.46 | 4.99 | 98.39 | 1.61 |
| Goiânia (GO) | 283.1 | 265.97 | 17.13 | 93.95 | 6.05 |
| Belo Horizonte (MG) | 268.23 | 266.65 | 1.58 | 99.41 | 0.59 |
| Fortaleza (CE) | 246.39 | 244.62 | 1.77 | 99.28 | 0.72 |
| Manaus (AM) | 241.27 | 231.48 | 9.79 | 95.94 | 4.06 |
| Campinas (SP) | 240.05 | 226.46 | 13.59 | 94.34 | 5.66 |
| Campo Grande (MS) | 193.44 | 176.7 | 16.74 | 91.35 | 8.65 |
| Porto Alegre (RS) | 189.89 | 185.08 | 4.81 | 97.47 | 2.53 |
| Salvador (BA) | 181.64 | 179.89 | 1.75 | 99.04 | 0.96 |
| Uberlândia (MG) | 145.82 | 119.42 | 26.4 | 81.9 | 18.1 |
| Guarulhos (SP) | 143.84 | 141.38 | 2.46 | 98.29 | 1.71 |
| Belém (PA) | 137.23 | 132.82 | 4.41 | 96.79 | 3.21 |
| São Luís (MA) | 135.66 | 124.25 | 11.41 | 91.59 | 8.41 |
| Ribeirão Preto (SP) | 135 | 127.92 | 7.08 | 94.76 | 5.24 |
| Aparecida de Goiânia (GO) | 134.31 | 132.92 | 1.39 | 98.97 | 1.03 |
| Teresina (PI) | 133.77 | 119.73 | 14.04 | 89.5 | 10.5 |
| Recife (PE) | 130.63 | 128.71 | 1.92 | 98.53 | 1.47 |
| Duque de Caxias (RJ) | 127.26 | 121.51 | 5.75 | 95.48 | 4.52 |
| Joinville (SC) | 124.38 | 119.35 | 5.03 | 95.96 | 4.04 |
| São Gonçalo (RJ) | 123.35 | 121.15 | 2.2 | 98.22 | 1.78 |
| Sorocaba (SP) | 122.56 | 117.99 | 4.57 | 96.27 | 3.73 |
| São José dos Campos (SP) | 118 | 109.54 | 8.46 | 92.83 | 7.17 |
| Cuiabá (MT) | 116.49 | 112.27 | 4.22 | 96.38 | 3.62 |
| Londrina (PR) | 116.14 | 103.49 | 12.65 | 89.11 | 10.89 |
| Nova Iguaçu (RJ) | 110.59 | 106.34 | 4.25 | 96.16 | 3.84 |
| São José do Rio Preto (SP) | 108.7 | 91.15 | 17.55 | 83.85 | 16.15 |
| Porto Velho (RN) | 107.75 | 96.36 | 11.39 | 89.43 | 10.57 |
In this edition of the Urbanized Areas of Brazil 2015, as in the previous one, images of the RapidEye satellite, produced from 2011 to 2014, were used. The mapping classifies urbanized areas as "dense" (with little spacing between build-up areas) and "not so dense" (with a more spaced occupation).The latter are characterized by portions of land where construction is in progress and often associated with the transition between rural and urban landscapes.
It is also possible to access the contents of the study in the Interactive Geographic Platform, where the user can visualize the urbanized areas together with other geographic divisions, thus, being able to make several types of analysis.
