In 2017, Brazil consumed 6.3 liters of water per each R$1 produced in economy


May 07, 2020 10h00 AM | Last Updated: May 11, 2020 03h13 PM
In 2017, the total consumption of water, which corresponds to the water used less the water that reverts to the environment, was 329.8 thousand hm3 (329.8 trillion liters). Agriculture, livestock, forestry, fishing and aquaculture was the major activity responsible for the consumption of water (97.4%).
In 2017, nearly 6.3 liters of water were consumed per each R$1.00 of Gross Value Added produced. However, the result of this indicator for Agriculture, livestock, forestry, fishing and aquaculture was 1,061 liters/R$. If not considered the volume of soil water used by this activity, 96 liters/R$ were needed in 2017.
Taking into account the soil water among the Major Regions in 2017, the Central-West registered the largest water consumption, with 1,511.9 liters per each R$1 produced in the region. If not including the volume of soil water, the Northeast showed the highest result, with 151.4 liters per each R$1 produced.
In Brazil, the total water withdrawal – both the withdrawal for self use and water collection for distribution purposes – was nearly 3.7 million hm3 (3.7 quadrillion liters) in 2017. The share of Hydroelectric Energy in the withdrawal was 83.0%, though the volume of water collected by this activity is almost all used and reverted with the same quantity and quality. Among the Major Regions, the Southeast recorded the largest share in the total water withdrawal in every year of the 2013-2017 series.
Considering the use of distribution water, the Southeast was the region with the largest share in 2017 (45%), followed by the Northeast (29%), South (14%), Central-West (6%) and North (6%).
In 2017, the additions to the total stock of water in Brazil were 27 million hm3 (27 quadrillion liters). Rainfall was the main responsible factor (51.1%), followed by upstream entries from other countries and from other resources in the territory (36.4%) and the reversal to the environment due to the economic activities (12.5%). The volume of rainfall recorded a cumulative drop of 13% between 2013 and 2016, growing again by 6% from 2016 to 2017.
In Brazil, the per capita use of water by Households was 116 liters per day in 2017. Among the Major Regions, the Southeast registered the largest per capita use, with 143 liters, while the smallest use was recorded in the Northeast, with 83 liters per inhabitant/day.
In 2017, the activity of Water and sewage represented 0.6% of the current Gross Value Added (GVA) of the total economy. The value of production of distribution water and sewage services was R$56.5 billion in 2017, with the distribution water responsible for 65.9% of this total.
This information refers to the Brazilian System of Environmental-Economic Accounts for Water (SEEA-Water) 2013-2017, the result of a cooperation between the IBGE and the National Water Agency (ANA), with the technical support from the German International Cooperation Agency for Sustainable Development (Deutsche Gesellschaft für Internationale Zusammenarbeit – GIZ GmbH), through the Ministry of Environment (MMA) and the European Union, in the scope of the Natural Capital Accounting and Valuation of Ecosystem Services (NCAVES) project.
In addition to a revision of the estimates for the 2013-2017 series, this publication shows data detailed by Major Region for the first time ever.
The publication and the support material of this release are on the right side of this page.
Total consumption of water in Brazil was 329.8 trillion liters in 2017
In 2017, the total consumption of water, which corresponds to the water used less the water that reverts to the environment, was 329.8 trillion liters. The major responsible factors for the consumption of water were Agriculture, livestock, forestry, fishing and aquaculture (97.4%), in which dry farming (non-irrigated) stands out, Manufacturing and construction industry (1.0%) and Water and sewage (0.8%).
The reversal of water to the environment can happen either through its collection by the activity of Water and sewage or through direct discharge by economic activities and households. In 2017, the total reversal was 3.4 quadrillion liters. Except for the Hydroelectric energy activity, rainwater that flows through pluvial networks and the activity of Agriculture, livestock, forestry and fishing, which does not use the sewage system, the total reversal was 22.1 trillion liters. Of this total, 28.9% occurred through the sewage systems and the remainder was directly discharged in the environment. Regarding households, the reversal percentage that flowed through the sewage system in relation to the use of water was 57.2%, that is, 42.8% of the total water that the households use was directly discharged in the environment.
| Level of water consumption (liters/R$) | |||||
|---|---|---|---|---|---|
| Economic activities | 2013 | 2014 | 2015 | 2016 | 2017 |
| Agriculture, livestock, forestry, fishing and aquaculture | 1,324.9 | 1,265.0 | 1,290.2 | 1,053.8 | 1,060.5 |
| Agriculture, livestock, forestry, fishing aquaculture (without soil water) | 104.9 | 108.9 | 109.5 | 95.5 | 95.5 |
| Mining and quarrying industries | 1.4 | 1.5 | 2.5 | 5.2 | 3.4 |
| Manufacturing and construction industries | 4.4 | 3.9 | 3.6 | 3.4 | 3.4 |
| Electricity and gas | 1.5 | 1.8 | 1.2 | 0.8 | 0.7 |
| Other activities | 0.2 | 0.1 | 0.1 | 0.1 | 0.1 |
Each R$1 of Gross Value Added consumed 6.3 liters of water in 2017
The indicator of the level of water consumption shows the consumed outflow, in liters, of water for each real of Gross Value Added (GVA) produced by the economic activities. In 2017, 6.3 liters of water were consumed per each R$1.00 of GVA. The result of this indicator for Agriculture, livestock, forestry, fishing and aquaculture was 1,061 liters/R$. The agricultural sector was responsible for the largest outflows consumed in Brazil. In the period between 2013 and 2017, the cumulative consumption of water dropped 19.9%. If not considering the volume of soil water used by agriculture, that is, considering only water coming from irrigation, the indicator changed to 96 liters/R$ in 2017.
Looking at the average cost per volume of water used – by relating the intermediate consumption expenses with distribution water with the water outflows received from the activity of Water and sewage –, it is noticed that, in 2017, the average cost of Agriculture, livestock, forestry, fishing and aquaculture was R$0.06/m3, where the volume of water supplied came predominantly from the public irrigation perimeters (PIP). Considering all the economic activities, except the activity of Water and sewage, the average cost per volume of water used was R$3.12/m3. Similarly, the final consumption expenses of households represented R$2.96/m3.
The analysis of the time series of the activity of Water collection, treatment and distribution showed a cumulative drop in the volume of water withdrawn for distribution (-2.7%) between 2013 and 2015, followed by a cumulative growth between 2015 and 2017 (3.3%). From 2013 to 2017, the average growth was 0.1%. The downward movement, followed by a recovery, was impacted by the water crisis occurred between 2014 and 2015. Its major users, i.e., Households, Agriculture, livestock, forestry and fishing, as well as Other activities, accounted for 63.7%, 19.8% and 14.5% of the use of distribution water in the economy in 2017, respectively.
Between 2013 and 2017, Households and Other activities registered, on average, -0.1% and -2.2%, respectively, of the total water used in the year. On the other hand, the activity of Agriculture, livestock, forestry and fishing registered an average growth of 2.0% in the same period. Concerning the expenses in the 2013-2017 time series, the expenditures of Households and Other activities with supply water grew, on average, 10.6% and 6.8%, respectively, in the period.
| Level of water consumption (liters/R$) - 2017 | |||||
|---|---|---|---|---|---|
| N | NE | SE | S | CW | |
| Agriculture, livestock, forestry, fishing and aquaculture | 482.3 | 762.5 | 1.289.8 | 984.0 | 1.511.9 |
| Agriculture, livestock, forestry, fishing and aquaculture (without soil water) | 38.1 | 151.4 | 116.5 | 86.4 | 63.3 |
| Mining and quarrying industries | 4.6 | 1.7 | 2.8 | 10.3 | 7.0 |
| Manufacturing and construction industries | 1.2 | 7.1 | 3.0 | 1.8 | 6.5 |
| Electricity and gas | 0.2 | 1.4 | 0.8 | 0.6 | 0.2 |
| Other activities | 0.3 | 0.1 | 0.1 | 0.1 | 0.0 |
In 2017, among the Major Regions, the Central-West recorded the highest level of water consumption, with 1,511.9 liters per each R$1 produced in the region, explained, among other factors, by the large concentration of dry farming activities. Considering the level of water consumption without the volume of soil water, the Northeast Region showed the highest result, with 151.4 liters per each R$1 produced by the activity, mainly because of the climate characteristics of the Semiarid, as well as the physiological characteristics of the major crops in the region.
Total water withdrawal from the economy was 3.7 million hm3
In Brazil, the total water withdrawal – both the withdrawal for self use and water collection for distribution purposes – was nearly 3.7 quadrillion liters in 2017.
At national level, the economic activity that mostly contributed to the volume of total withdrawal was Electricity and gas, due to the large amount of water turbocharged by hydroelectric plants and its major share in electricity production in Brazil. In 2017, the share of Hydroelectric Energy was 83.0%, though the volume of water collected by this activity was almost all used and reverted with the same quantity and quality, which is characterized as a non-consumptive use. Among the Major Regions, the Southeast recorded the largest share in the total water withdrawal in every year of the 2013-2017 series.
In the activity of Sewage and related activities, water withdrawal corresponds to the collection of rainwater that flows through pluvial networks, registered with the same volume both in withdrawal and in reversal to the environment. In 2017, this volume corresponded to 0.8% of the total water withdrawal.
Except for the two activities above, the major direct water collection, that is, that considered only the consumptive use were: Agriculture, livestock, forestry and fishing (94.5%) and Water collection, treatment and distribution (3.2%).
In the classification by type of water, 93.5% of the volume of water withdrew by the activity of Agriculture, livestock, forestry and fishing in 2017 came from water stored in the soil – mainly used by dry farming, non-irrigated – and the remaining came from superficial and subterranean water bodies.
Among the Major Regions, considering only the use in which water is consumed (consumptive use), the largest volume of total water withdrawal was registered in the Central-West Region (30%), mainly due to dry farming, followed by the Southeast (26%), South (25%), Northeast (12%) and North (7%).
Considering only water withdrawal from superficial and subterranean waters by economic activities for consumptive use in 2017, the total collected was 66.0 trillion liters. Agriculture, livestock, forestry and fishing was the major responsible (55.9%), followed by the activities of Collection, treatment and distribution of water (29.6%) and Manufacturing and construction industries (9.1%).
In this analysis, water withdrawal followed the following approximate distribution among the Major Regions in 2017: Southeast (35%), South (26%), Northeast (23%), Central-West (10%) and North (6%). Like it occurred at national level, the economic activity with the highest weight in this type of water withdrawal was, in all the Major Regions, Agriculture, livestock, forestry and fishing, varying in every region and prevailing in the regions where dry farming was more relevant.
Water used by the economic activities and households may come either from the withdrawal for self service or from a service of Collection, treatment and distribution of water, like companies that supply water or that provide water used in the PIPs. Considering only the volume of water distributed for economic activities, the PIPs had a share of 54.6% in 2017. In the economic activities, water withdrawal for self service prevailed in relation to water coming from Collection, treatment and distribution of water. In regard to households, 91.9% of the water came from other economic activities.
Considering the use of distribution water, the Southeast was the region with the largest share in 2017 (45%), followed by the Northeast (29%), South (14%), Central-West (6%) and North (6%). This result was influenced by the water flow coming from the PIPs, of which 75% were concentrated in the Northeast Region. Considering only the distribution of treated water from the supply companies, the Southeast became the responsible region for more than half of the total distribution water in Brazil.
Volume of rainfall fell 13% between 2013 and 2016
Rainfall, the upstream of water from rivers with headwaters abroad and the reversal of water used by the economic activities to the environment comprised additions to the stocks. On the other hand, evaporation, plant transpiration, water withdrawal by the economic activities and the downstream of water from rivers to the sea or to other countries comprise decreases in the stocks.
In 2017, the additions to the total stock of water in Brazil were 27 quadrillion liters. Rainfall was the main responsible factor (51.1%), followed by upstream entries (36.4%) and the reversal to the environment due to the economic activities (12.5%). The volume of rainfall recorded a cumulative drop of 13% between 2013 and 2016, growing again by 6% from 2016 to 2017.
Still in 2017, the reduction of the total stock of water in Brazil was 33 quadrillion liters. Downstream were the major responsible factor (61.9%), followed by evaporation/transpiration (27.0%) and water collection by the economic activities (11.1%).
Concerning the Major Regions, the one that mostly contributed to the inflow of water in the national stock was the North (98.8%), due to the participation of water upstream from other countries in the Amazon Basin. The major region responsible for the outflow from the stock of water in Brazil was also the North (80.6%), followed by the South (11.1%) and Central-West (5.4%).
Total per capita use of water by Households per day (liters/inhabitant/day) - 2017
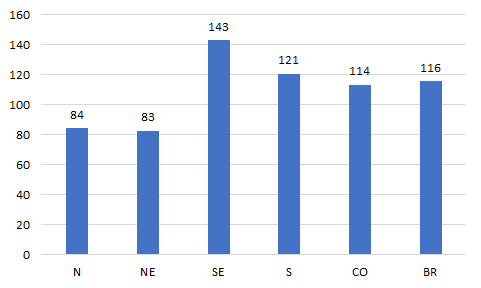

Per capita use of water by households in 2017 was 116 liters/day
In Brazil, the per capita use of water by Households was 116 daily liters in 2017. The Southeast registered the largest per capita use, with 143 liters, while the smallest use was recorded in the Northeast, with 83 liters per inhabitant/day. Still considering the households and the share of the volume of sewage collected by the sewage network in relation to the volume of water used, the Southeast was the region that recorded the largest result in 2017 (71%). In contrast, only 14% of the water used by households reverted to the environment through the collection network in the North Region.
Value of the production of water and sewage was R$56.5 billion in 2017
In 2017, the activity of Water and sewage represented 0.6% of the current Gross Value Added (GVA) of the total economy. The value of production of distribution water and sewage services was R$56.5 billion in 2017, with the distribution water responsible for 65.9% of this total. On the demand side, that is, that of the expenses, the households were the major responsible factor for the use of distribution water (61.5%) and sewage services (62.1%) in 2017. In the South, Central-West and Northeast regions, the activity of Water and sewage corresponded to nearly 0.6% of the current GVA. The percentage was 0.3% and 0.7%, respectively, in the North and Southeast regions.
In regard to the cost of the services of water distribution and sewage services, the Central-West posted the highest values in 2017, with R$4.71 per each 1,000 liters. On the other hand, the regions that registered the lowest values were the North and Northeast.
In the Northeast, the demand of water coming from the activity of Water and sewage was higher than that of households.
In the case of volume of water coming from the activity of Water and sewage, households demanded the most in all the Major Regions compared with the economic activities, except for the Northeast Region. In this region, the demand of water for irrigation supplied by the activity of Water and sewage surpassed the demand of water by households by nearly 30% in 2017. It occurred mainly due to the volume of water from the PIPs, demanded by the activity of Agriculture, livestock, forestry and fishing.


