POF 2017-2018
30% of the population with the lowest earnings live on less than the necessary amount to make ends meet


November 25, 2020 10h00 AM | Last Updated: November 26, 2020 12h51 PM
Highlights
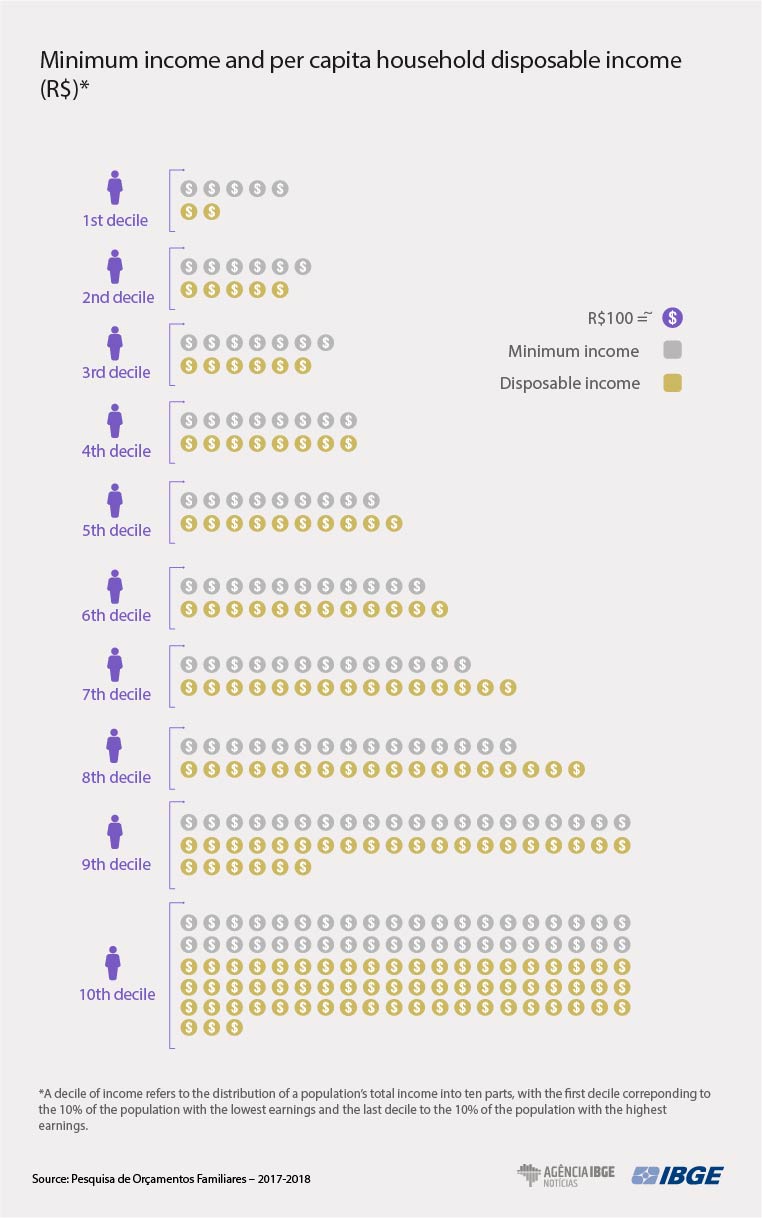
- Between 2017 and 2018, disposable income was R$ 1,650.78, on the average, and the minimum income was R$ 1,331,57.
- The minimum reported income of the 10% with the highest earnings was 8.5 times that of the 10% with the lowest earnings.
- Spending amounted to R$ 1,370.53, being most of it on housing.
- Spending on public utility services was mainly composed of communication and electricity expenses.
- Almost 25% of the persons lived in households with limited access to healthcare services.
- Non-monetary spending surpassed monetary spending when it comes to education.
- Data can be found in the Consumer Expenditure Survey – Profile of Spending in Brazil.
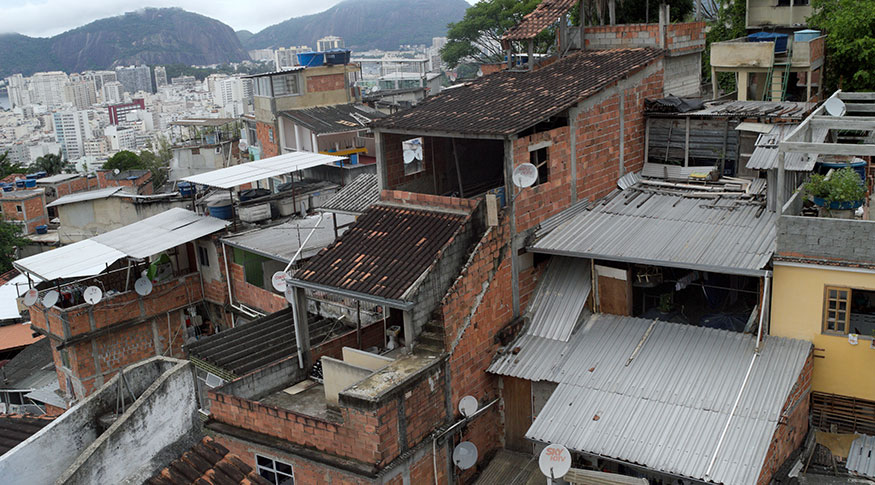
About 30% of the persons with the lowest earnings in the country, between 2017 and 2018, lived on less than the amount they considered necessary to make ends meet throughout the month. That is evidenced in the Consumer Expenditure Survey (POF) – Profile of Spending in Brazil, released today (25), by the IBGE, which shows the average monthly disposable income of this part of the population was below the minimum income reported as necessary.
In the first income range, a person earned, on average, R$ 244.60 per month, but would need almost twice as that amount (R$ 470.29) to cover their basic needs. That difference remains up to the third income range, whereas in the fourth one per capita income then surpasses (R$ 808.40) the minimum income (R$ 789.59).
The proportion is inverted as income increases. In the last highest income range, where disposable income was R$ 6,294.83, persons considered that R$ 4,001.09 would be the minimum needed to make ends meet. That is, the 10% with the highest earnings reported needing 8.5 times that of those with the 10% lowest earnings (R$ 470.30) in order to make ends meet throughout the month.
“The amount one sees as minimum depends on their disposable income and, of course, on their consumption habits. Data shows people’s views on that change according to their income range,” Leonardo Oliveira, manager of the survey, explains.
Between 2017 and 2018, disposable income was R$ 1,650.78, on average, and minimum wage, R$ 1,331.57. A total 86.9% of the disposable income was monetary, 23%, non-monetary less 9.9% direct taxes, contributions and deductions.
“The monetary share of income corresponds to amounts from work or transfers, such as retirement pensions, pensions and social programs. Non-monetary income, in turn, refers to gods and services that families do not pay for, including those provided by the government, institutions and other households, for example, medicines offered by a healthcare unit, a gift or green vegetables taken from one’s own vegetable garden, for example,” Mr. Oliveira explains.
Spending is highest on housing
Consumption spending amounted to R$ 1,370,53, being most of it on housing (R$ 466.34), followed by transportation (R$ 234.08) and housing (R$ 219.44).
On average, a person spent R$ 264.66, per month, on housing, including rent, estimated rent, condominium fees and taxes. “About 1.7% of the persons lived in housing units whose rental surpassed 1/3 of the net disposable income, which is considered too high. Centage was that of the Southeast (1.0%),” analyst Luciana Santos remarks.
Spending on public utility services, such as electricity, water and sewage fees, domestic gas and communication (landline and mobile telephony, subscription TV and Internet), was R$ 114.12, being most significant on communication services (R$ 45.16) and electricity (R$ 39.64).
“Persons in the lowest income strata spent most of their budget on electricity, being 42.2% in the first range. On the other hand, communication services made up most of the spending in households with the highest earnings, with 53.7% of the persons in households of the last income range,”, Ms. Santos adds.
Almost 25% of the persons live in households with limited access to healthcare services
Per capita spending on healthcare was R$ 133.23, being R$ 90.91 of monetary spending, with cash disbursement for the acquisition of the good or service. Non-monetary spending was R$ 42.32. In this case, without disbursement, the product or service is provided by the government or other entities.
Most of the total spending was on healthcare services (R$ 86.48) and the remainder on medicines and pharmaceutical products (R$ 46.75).
Between 2017 and 2018, 26.2% of the persons belonged to households with somewhat limited access to healthcare services and 16.4% to medicines. “Lack of Money was the main reason reported for limited healthcare access (16.9%) and for the acquisition of medicines (11.0%),”Isabel Martins, analyst of the survey, explains, as she adds that households with children had more significant restrictions in the case of healthcare (12.9%) and medicines (8.4%) than households with elderly persons (5.7% and 3.7%, respectively).
The survey also shows that only 18.1% of the persons lived in households where all members had health insurance and that 17.4% did where at least one person had access to that type of service. Most persons, however, lived in housing units where no one had access to health insurance (64.4%).
In the period analyzed, 44.6% of the persons lived in households where health was ranked as good; 28,9% as satisfactory and 26.5% as bad. Among those who ranked health as bad, 22.1% lived in urban areas, and 4.3%, in rural ones. The evaluation was also varied among Major Regions. The biggest percentage of those who saw health as good was in the Southeast (19.7%), and the smallest, in the North (3.3%). The biggest proportion of bad evaluations was observed in the Southeast; the smallest, in the Central West (1.90%).
Non-monetary spending on education surpasses monetary spending
POF also shows that the average per capita spending on education was R$ 120.16. A total R$ 68.13 of it referred to non-monetary spending, without cash disbursement, as it is the case of public education provided by the government. Monetary spending amounted to R$ 52.03. That refers to either cash or forward payment.
“Almost all the components of spending on education follow that pattern. From primary education to high school, non-monetary spending surpasses monetary spending, since basic education is most often provided by the government. However, when it comes to higher education (including graduate studies) and in other education programs , monetary spending is higher than non-monetary spending, because most courses are offered by private institutions,” researcher José Mauro de Freitas Júnior explains.
“Net lending of education also varies with household income. For example, households in the two highest income ranges ended up spending more in private education. The same is true in the case of reference persons with a higher education degree,” the IBGE analyst adds.
Also according to the survey, household spending on education was higher (R$ 73.62) when the reference person was a man (R$ 46.54). tribute with R$ 61.79 and black or brown, with R$ 55.94. The higher the level of schooling of the reference person, the biggest their household spending on education.
About 60.9% of the persons lived in housing units where education pattern was evaluated as good; 27.5% in those where education was ranked as satisfactory and 11.7% as bad. Among those who saw education as good, 42% lived in the Southeast (25.6% of the population overall), the same Major Region where 44.4% of the persons lived in households where education was ranked as bad (5.2% of the population).