Households spend 36% more with health per person than government


December 20, 2017 10h00 AM | Last Updated: December 20, 2017 11h43 AM
The per capita expenditure of households and non-profit institutions with health goods and services was of R$1,538.79 in 2015, 36% higher than the per capita expenditure of government, which was of R$1,131.94. This information is from the Health Satellite Account 2010-2015, released today by the IBGE.
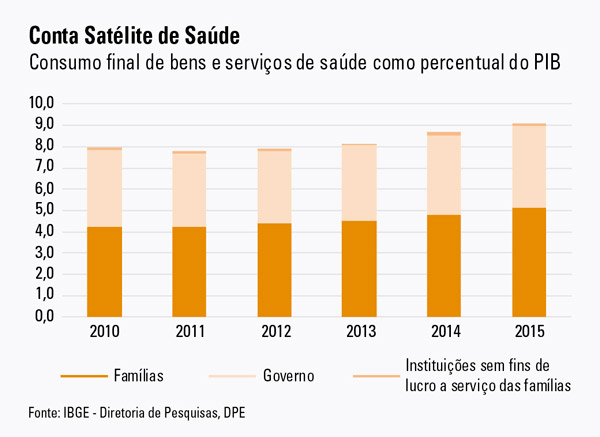
In 2015, the expenditures with health accounted for 9.1% of the Brazilian GDP, being 5.1% from households, 3.9% from government and 0.1% from non-profit institutions serving households.
Households spent mostly with private health services, which includes health plans. This expense (R$204.4 billion) reached 3.4% of the GDP in 2015. The expense with medicines was of R$92.5 billion, about 1.5% of the GDP.
Public health represented the major expense of government in 2015: R$184.2 billion or 3.1% of the GDP. Government spent 0.6% of the GDP (R$36.2 billion) with private health services and 0.2% (R$10.9 billion) with medicines for free distribution.
"Considering just health services, i.e., medical care, hospitalizations and medical examinations, expenses of government and households are too close, a little higher for government. Yet government assists a much higher amount of users", explains Ricardo Moraes, Manager of Goods and Services of the IBGE´s Coordination of National Accounts.
Whenever transfers like those made to the "Aqui tem Farmácia Popular" program are considered in addition to the final consumption, 45.1% of health funding comes from government and 53.6%, from households.
Expenditures with health change from 8.7% to 9.1% of GDP between 2014 and 2015
The final consumption of health goods and services was of R$546 billion, which represents 9.1% of the GDP. This percentage was 8.7% in 2014 and 8.2% in 2013. According to Moraes, the proportion rose in 2014 because the consumption of these products increased indeed. In 2015, the consumption was not so responsible for the increase – as it grew relatively less –, but rather the drop in the GDP.
"The consumption of health services is not expected to remain stable, even with the economic downturn, as the population grows and this alone represents an increase in the demand. Moreover, population aging also increases the consumption: the population cannot stop using health goods and services", explained Moraes.
The consumption of health goods and services has been growing since 2010, when the time series started. In 2015, the growth in volume – discounting price changes – was of 0.5% for government consumption and 1.6% for households. The consumption of non-health goods and services by government fell 2.0% in 2015, whereas the consumption by households dropped 3.6%.
"The population grows, on average, 0.8% per year. So, the 0.5% increase in government is actually a per capita drop. But if you look at the remaining consumption of government, which is basically education and public administration, the drop was of 2.0%", pondered Moraes.
Text: Irene Gomes
Artwork: Helga Szpiz